
Figure 4
- ID
- ZDB-IMAGE-230217-126
- Genes
- Publication
- Wang et al., 2023 - Behavioral and Sensory Deficits Associated with Dysfunction of GABAergic System in a Novel shank2-Deficient Zebrafish Model
- All Figures
- Figures for Wang et al., 2023
|
Figure 4
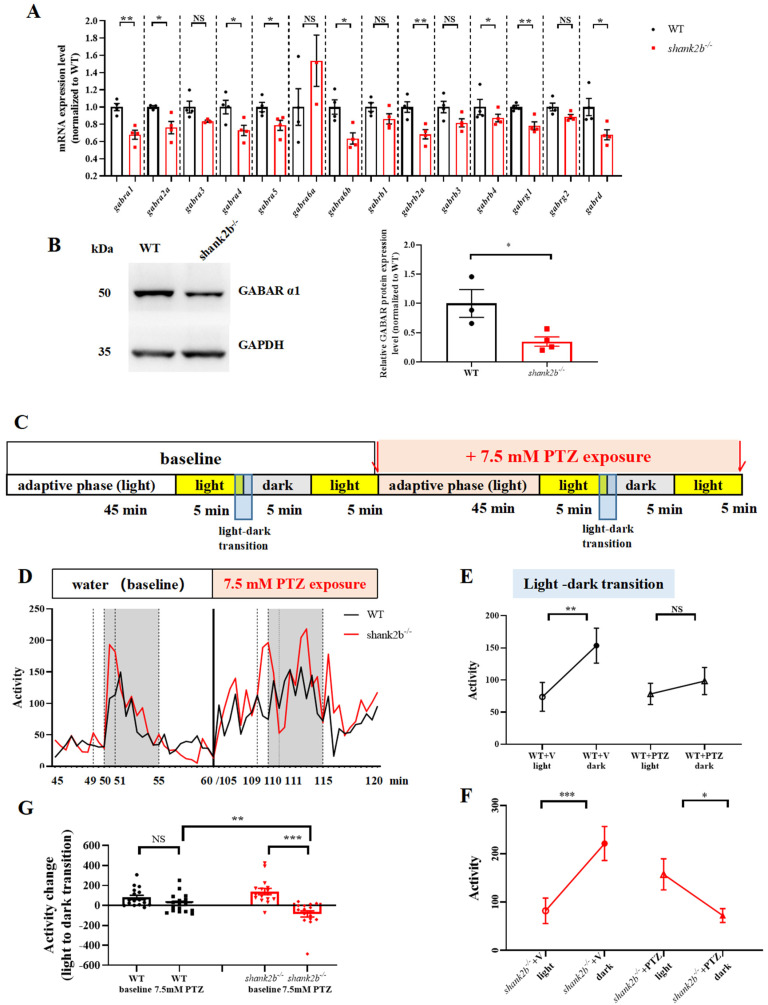
The shank2b mutants display GABAergic deficits. (A) RT-qPCR showed altered expression levels of GABAR subunits in adult shank2b−/− brain tissue. gabra1, ** p = 0.003; gabra2a, * p = 0.0394; gabra3 ns p = 0.0993; gabra3 ns p = 0.0660; gabra4, * p = 0.0341; gabra5, * p = 0.0371; gabrg2 ns p = 0.0730; gabra6a ns p = 0.3488; gabra6b, * p = 0.0138; gabrb1 ns p = 0.1258; gabrb2a, ** p = 0.0083; gabrg1, ** p = 0.005; gabrd, * p = 0.0318; n = 3–4 for each group. Student’s t test. Data are presented as the mean ± SEM. (B) Western blot analysis of GABA A receptor α1 protein in adult shank2b−/− brain tissue. * p = 0.0313, WT n = 3, shank2b−/− n = 4, Student’s t test. Data are presented as the mean ± SEM. (C) Pentylenetetrazol (PTZ)-treated behavior experimental procedure. (D) The experiment consisted of basal activity change during light to dark transition and 7.5 mM PTZ-treated induced activity change exposure to the same basal experiment. (E) WT larva at 9 dpf exhibited a dynamic increase of activity during light–dark transitions (WT + v (vector) light vs. WT + v dark, ** p = 0.0022,; n = 17, paired t test). Remarkably, PTZ concentrations of 7.5 mM of WT larva at 9 dpf did not elict a decline in activity (WT + PTZ light vs. WT + PTZ dark, ns, p = 0.3869, n = 17, paired t test). (F) However, 7.5 mM PTZ elicited a decline in activity of shank2b mutants (shank2b−/− + V light vs. shank2b−/− + V dark, *** p = 0.0005; shank2b−/− + PTZ light vs. shank2b−/− + PTZ dark, * p = 0.0157; n = 16, paired t test). (G) Interestingly, the activity change of shank2b larvae at 9 dpf after 7.5 mM PTZ treatment was more than the activity change before PTZ treatment (shank2b−/− − baseline vs. shank2b−/− + PTZ, *** p = 0.0006, n = 16, paired t test), and even greater than the activity change after WT larvae treated with PTZ (WT + PTZ vs. shank2b−/− + PTZ, ** p = 0.0096, WT + PTZ n = 17, shank2b−/−+ PTZ n = 16 Student’s t test). Remarkably, WT larva at 9 dpf did not have significant difference in the activity change during light–dark transition before and after 7.5 mM PTZ treatment (WT-baseline vs. WT + PTZ, ns p = 0.0961, n = 17, paired t test).