
|
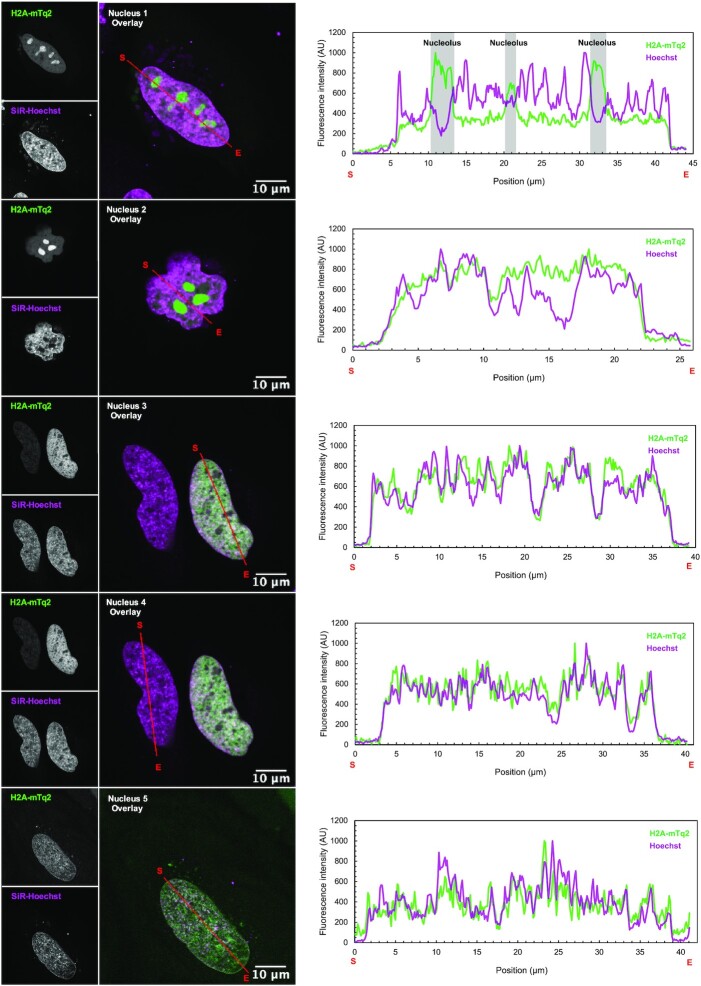
Fig. 3
The overlap between H2A-mTurquoise2 (green) and SiR-Hoechst (magenta) signals in HeLa cells (Confocal microscopy, single Z-plane). Nuclei 1 and 2: Extensive nucleolar accumulation of H2A-mTurquoise2 (H2A-mTq2) drowns its fluorescent signal over the rest of the nucleus. Line scans (marked in red with start and end positions indicated with S and E, respectively) across such nuclei show that the H2A-mTq2 signal only recapitulates that of SiR-Hoechst when the line scan does not cross a nucleolus. Nuclei 3, 4, and 5: in cells expressing low levels of H2A-mTq2 (nuclei 3 and 4), and in nuclei with no visible nucleoli (nucleus 5) the distribution of the SiR-Hoechst and H2A-mTq2 signals are comparable.