
|
Fig. 7
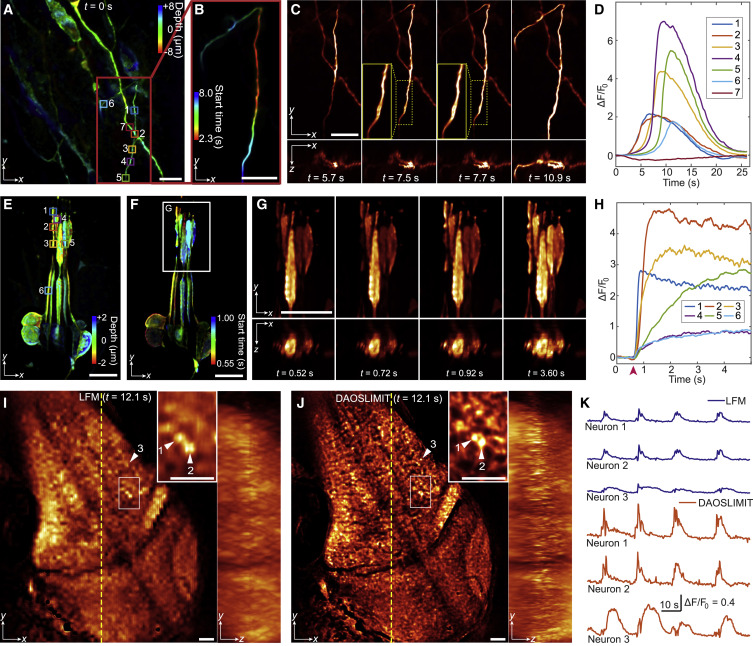
Figure 7. 3D calcium dynamics in human cerebral organoids, Drosophila larvae, and zebrafish larvae (A) Color-coded MIPs of GCaMP6s-labeled human 3D cerebral organoids. (B) Temporally coded MIPs of the selected area in (A). Different colors correspond to the start time. (C) Orthogonal MIPs at different time stamps (Video S6, part I). (D) Temporal traces (ΔF/F0) of the ROIs labeled in (A). (E) Color-coded MIPs of Drosophila larval Cho neurons labeled with the jGCaMP7s indicator. (F) Temporal-coded MIPs for the start time. (G) Orthogonal MIPs at different time stamps (Video S6, part II). (H) Temporal traces (ΔF/F0) of the ROIs labeled in (E). The red arrow indicates the 500-Hz sound stimulus. (I and J) Orthogonal MIPs of GCaMP6s-labeled zebrafish larva imaged by traditional LFM (I) and DAOSLIMIT (J) (Video S6, part III). (K) Temporal traces of the same neurons obtained by LFM and DAOSLIMIT marked by arrows in (I) and (J). Scale bars: 10 μm (A–G) and 30 μm (I and J). See also Video S6.
Reprinted from Cell, 184, Wu, J., Lu, Z., Jiang, D., Guo, Y., Qiao, H., Zhang, Y., Zhu, T., Cai, Y., Zhang, X., Zhanghao, K., Xie, H., Yan, T., Zhang, G., Li, X., Jiang, Z., Lin, X., Fang, L., Zhou, B., Xi, P., Fan, J., Yu, L., Dai, Q., Iterative tomography with digital adaptive optics permits hour-long intravital observation of 3D subcellular dynamics at millisecond scale, 3318-3332.e17, Copyright (2021) with permission from Elsevier. Full text @ Cell