
Figure 7
- ID
- ZDB-IMAGE-221226-335
- Genes
- Publication
- Weeks et al., 2022 - Embryonic alcohol exposure disrupts the ubiquitin-proteasome system
- All Figures
- Figures for Weeks et al., 2022
|
Figure 7
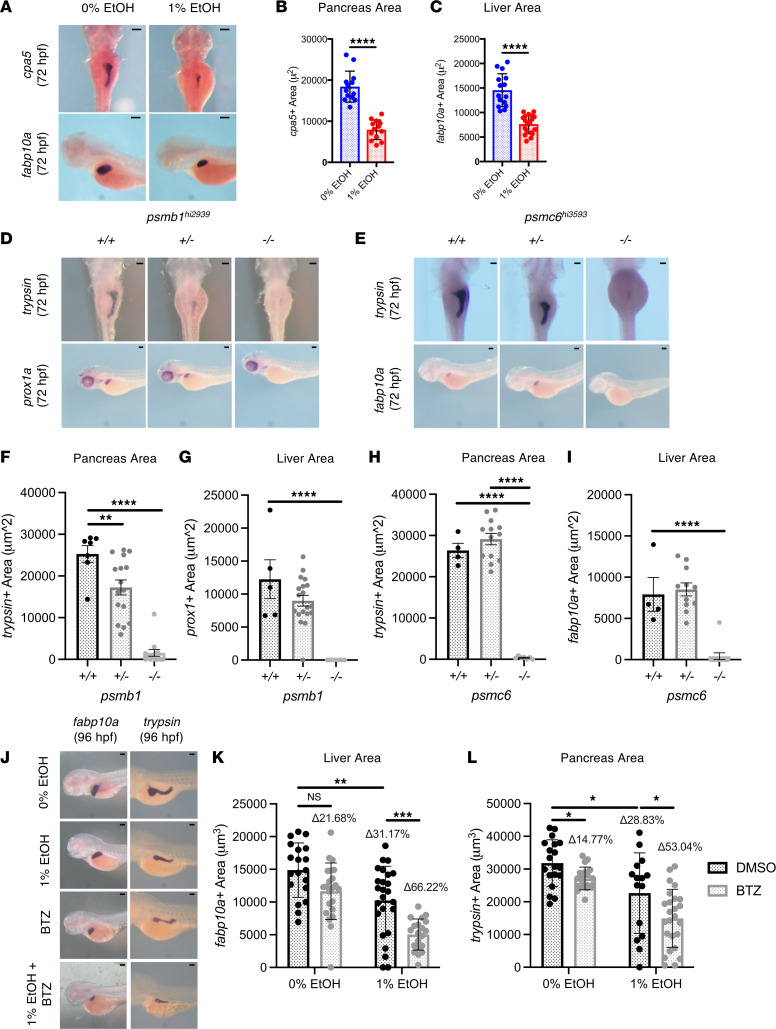
(A) ISH for exocrine pancreas marker cpa5 and hepatocyte marker fabp10a. EtOH (1%) (12–72 hpf) reduced exocrine pancreas and liver size. (B and C) ImageJ quantification of pancreas and liver size (****P ≤ 0.0001, unpaired 2-tailed t test, n ≥13). (D and E) ISH for exocrine pancreas marker trypsin and hepatocyte markers prox1a and fabp10a in psmb1hi2939 and psmc6hi3593 (72 hpf) mutants. (F–I) Quantification of pancreas and liver size using ImageJ. psmb1+/–, psmb1–/–, and psmc6–/– have significantly reduced exocrine pancreas size. psmb1–/– and psmc6–/– have significantly reduced liver size (n > 4, ****P ≤ 0.0001, **P < 0.01, ordinary 1-way ANOVA with Dunnett’s multiple-comparison test). (J–L) ISH for liver marker fabp10a and exocrine pancreas marker trypsin, followed by quantification of organ size using ImageJ area calculation at 96 hpf. EtOH (1%) (12–96 hpf) significantly reduced liver and pancreas size. Treatment with BTZ significantly exacerbated the effects of EAE on liver and pancreas area (*P < 0.05, **P < 0.01, ***P < 0.001, 2-way ANOVA with Sidak’s multiple comparisons). BTZ concentration = 2.5 μM (12–96 hpf). Scale bars: 100 μm. From left, column sample n = 7, 16, 13 (F); n = 6, 20, 7 (G); n = 6, 20, 7 (H); n = 5, 12, 12 (I); n = 19, 21, 25, 19 (K); and n = 19, 19, 15, 25 (L). Data represent mean ± SD.