
Figure 3
|
Figure 3
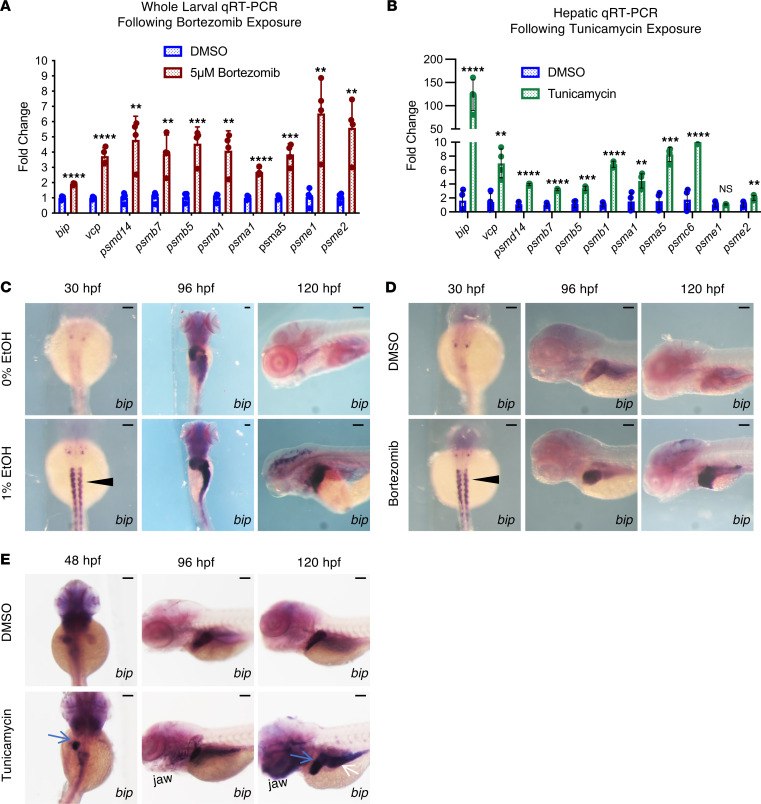
(A and B) qPCR analysis of 5 dpf whole-larval extracts from DMSO and BTZ treatment (16 hours) (A) and 60 dpf whole-liver extracts from DMSO and Tm treatment (12 hours). Expression was normalized to ef1α. Discovery was determined using the 2-stage linear step-up procedure of Benjamini, Krieger, and Yekutieli, (**P ≤ 0.01, ***P ≤ 0.001, ****P ≤ 0.0001; each gene was analyzed individually using an unpaired 2-tailed t test). (C) ISH for bip following 0% and 1% EtOH (exposure window 12 hpf–5 dpf) treatment. EAE increases bip expression in the somites at 30 hpf (black arrowhead), and the liver, intestine, and brain from 96 to 120 hpf. (D) ISH for bip following DMSO and BTZ (exposure window 12 hpf–5 dpf) treatment. BTZ increases bip expression in the somites at 30 hpf (black arrowhead), and the liver, intestine, brain, and pancreas from 96 to 120 hpf. (E) ISH for bip in DMSO- and Tm-treated embryos. Tm increases bip expression in the endoderm, including the hepatoblasts (48 hpf, blue arrow), liver (120 hpf, blue arrow), and gut tube (120 hpf, white arrow). Scale bars: 100 μm. Data represent mean ± SD.