
Fig. 6
- ID
- ZDB-IMAGE-221223-6
- Genes
- Publication
- Lei et al., 2021 - Noncanonical protease-activated receptor 1 regulates lymphatic differentiation in zebrafish
- All Figures
- Figures for Lei et al., 2021
|
Fig. 6
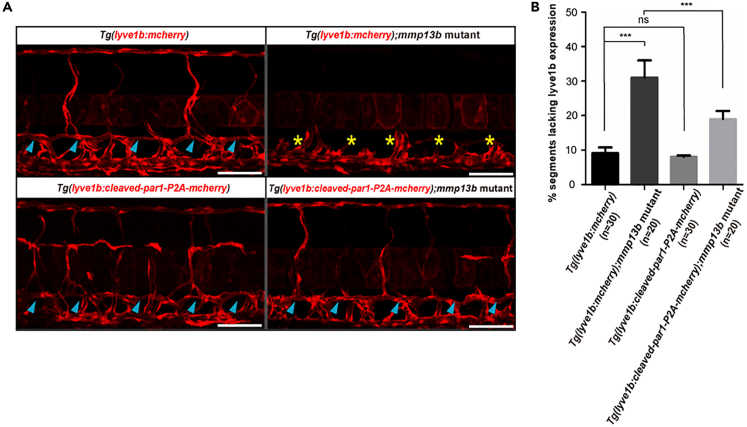
Overexpression of cleaved par1 recovers the lymphatic phenotypes observed in mmp13b zebrafish mutants
(A) Confocal images showing TD formation of siblings and mmp13b homozygous mutants in the Tg(lyve1b:mcherry) line and Tg(lyve1b:cleaved-par1-P2A-mcherry) line at 5 dpf. Blue arrowheads indicate TD formation in each somite; yellow asterisks represent the absence of TD formation in each somite. Scale bars: 100 μm.
(B) Percentage of somites lacking TD formation in siblings with the Tg(lyve1b:mcherry) line (n = 30 embryos), mmp13b homozygous mutants with the Tg(lyve1b:mcherry) line (n = 20 embryos), siblings with the Tg(lyve1b:cleaved-par1-P2A-mcherry) line (n = 30 embryos), and mmp13b homozygous mutants with the Tg(lyve1b:cleaved-par1-P2A-mcherry) line (n = 20 embryos); 6 somites/embryos were used for quantification. In (B), values represent means ± SEMs. ∗p ≤ 0.01, ∗∗p ≤ 0.001 in the Student's t test.