
Figure 3
- ID
- ZDB-IMAGE-221214-227
- Publication
- Kang et al., 2022 - Disruption of the glucagon receptor increases glucagon expression beyond α-cell hyperplasia in zebrafish
- All Figures
- Figures for Kang et al., 2022
|
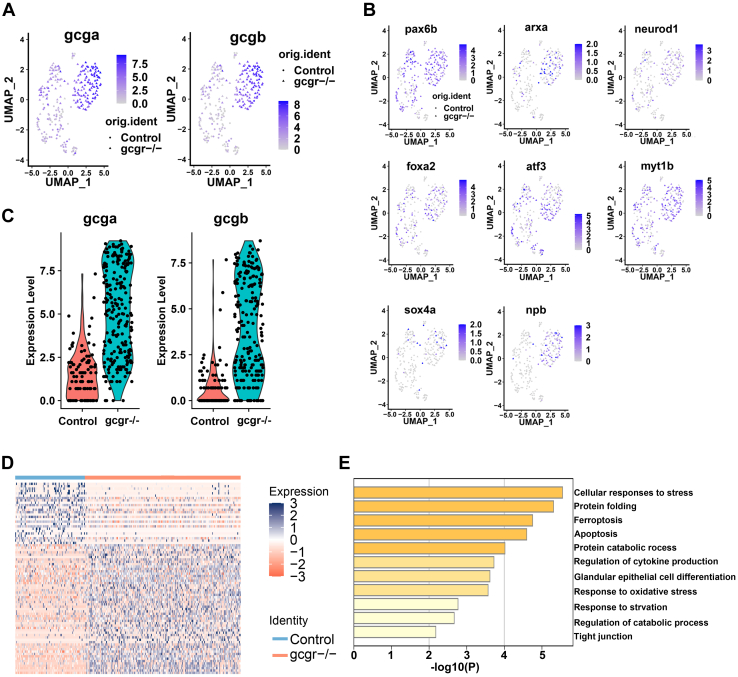
Figure 3
KO of GCGR in zebrafish increased glucagon expression in α-cells.A and B, the plots show the expression of glucagon genes (A) and their regulators (B). The color scale ranges gray to blue corresponding to expression level from low to high; all plots are based on cell clusters shown in Fig. 1B. C, the violin plots show gcga and gcgb relative expression in α-cells from control and gcgr−/− zebrafish. D, heatmap of differentially expressed genes (DEGs) of gcgr−/− compared to control cells; the color scale ranges red to blue corresponding to expression level from low to high. E, pathway enrichment analysis of DEGs between gcgr−/− and control cells. GCGR, glucagon receptor.