
|
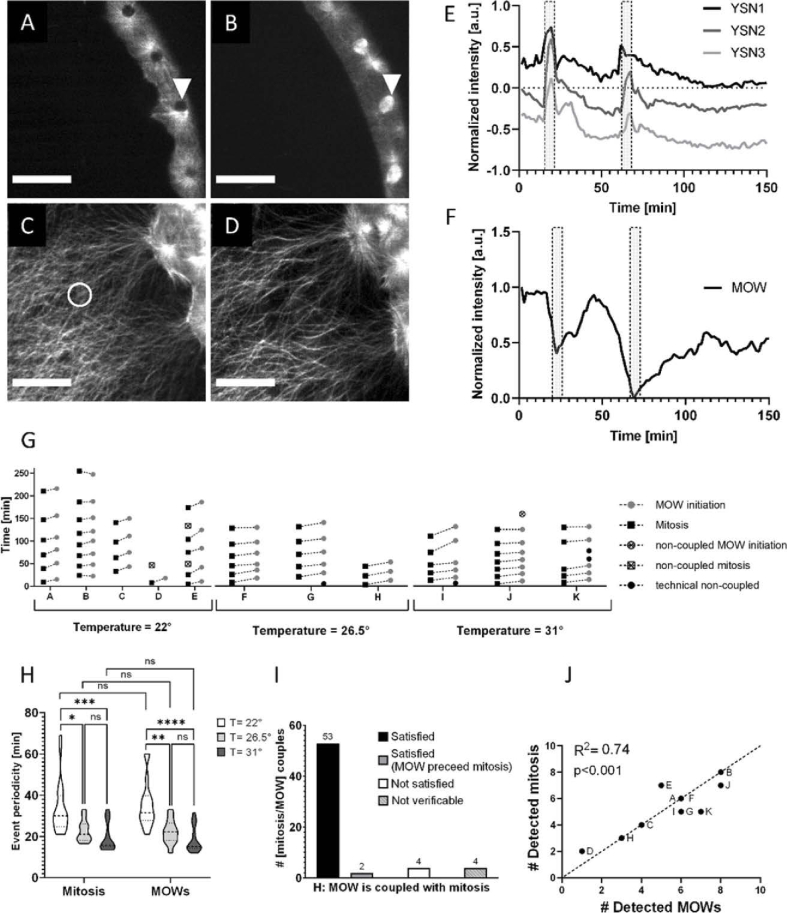
Fig. 4 MOWs depend on the cell/eYSN divisions. (A-B) Internal slices from the 3D stack showing the YSN (white arrow) before (A) and during (B) a mitotic event. (C-D) Maximum intensity projection for the same area in (A-B), showing the MT network emerging from the YSN, before (denser network, C) and after (sparser network, D) the YSN mitotic event. Scale bars 50 µm. (E) Normalized mean intensity profiles of three YSN tracked through the 3D stack over time, recording their last two divisions (overlaid bars). For better visualization, an incremental offset is applied to avoid graphs’ overlapping. (F) Normalized mean intensity profile from a 19 µm ROI (white circumference in (C)) over the MT branch from the maximum intensity projection over time. The retrieved graph records the last two MOWs’ initiations (overlaid bars), corresponding to the YSN divisions in (E). (G) Time points at which mitosis (squares) and MOWs’ initiations (circles) happens, for embryos at different temperatures. Each letter identifies one embryo. (H) Violin plots resuming the effect of experimental temperature on periodicities of mitosis (left part) and MOWs’ initiations (right part). p-values: ns = p>0.05, *= p<0.05, **= p<0.01, ***= p<0.001, ****= p<0.0001. (I) Overview on the 63 analysed [mitosis/MOW initiation] coupled events and their outcome to the hypothesis “MOW initiation coupled with mitosis”. (J) Correlation graph between the number of detected MOW initiation and of detected cell/YSN divisions from each embryo (letters). Dotted line represents identity line. See also Supplement 1 Fig. S2.