
Image
|
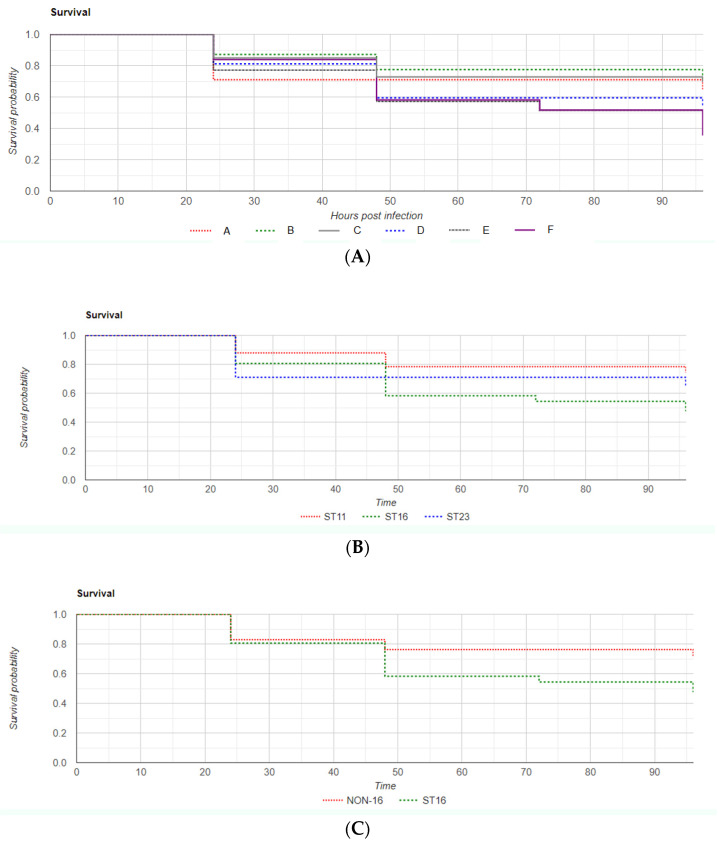
Figure Caption
Figure 2
Overall zebrafish Kaplan–Meier survival curve (A) according to K. pneumoniae strain of infection; (B) Kaplan–Meier curves when grouping survival of embryos by ST of infection; (C) Kaplan–Meier survival curves comparing zebrafish infection by K. pneumoniae ST16 strains with non-ST16 strains. Time is expressed in hours post-infection (hpi).
Figure Data
Acknowledgments
This image is the copyrighted work of the attributed author or publisher, and
ZFIN has permission only to display this image to its users.
Additional permissions should be obtained from the applicable author or publisher of the image.
Full text @ Antibiotics (Basel)