
Fig. 6
- ID
- ZDB-IMAGE-221119-40
- Publication
- Edmister et al., 2021 - A zebrafish model for calcineurin-dependent brain function
- All Figures
- Figures for Edmister et al., 2021
|
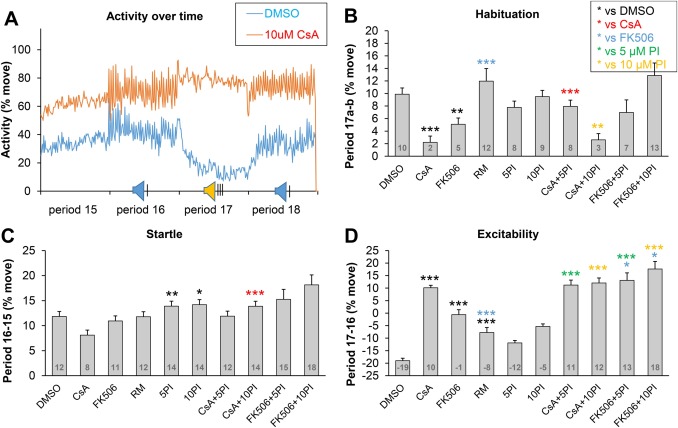
Fig. 6 Fig. 6. Responses to acoustic stimuli. A) Example of one imaging experiment analyzed during the final 40 min in 6-second intervals. B) Habituation to acoustic stimuli at 1-second intervals (first 5 min minus last 5 min of period 17). C) Startle responses (average activity in period 16 minus period 17). D) Excitability by acoustic stimuli at 1 s intervals (average activity in period 17 minus period 16). Larvae were treated at 5 dpf with DMSO (2 μl/mL), cyclosporine (CsA, 10 μM), tacrolimus (FK506, 1 μM), rapamycin (RM, 1 μM), proINDY (5PI = 5 μM proINDY, 10PI = 10 μM proINDY), or a combination of two treatments. Differences between corresponding groups were examined for significance using a Chi-square test with a Bonferroni correction for multiple comparisons. N in panel A = 96 larvae per treatment group. N in panel B, C and D = 912, 372, 188, 263, 383, 275, 190, 178, 93 and 86 larvae in the 10 subsequent treatment groups. * p < 0.05/14), ** p < 0.01/14), *** p < 0.001/14).