
Fig. 5
- ID
- ZDB-IMAGE-221119-39
- Publication
- Edmister et al., 2021 - A zebrafish model for calcineurin-dependent brain function
- All Figures
- Figures for Edmister et al., 2021
|
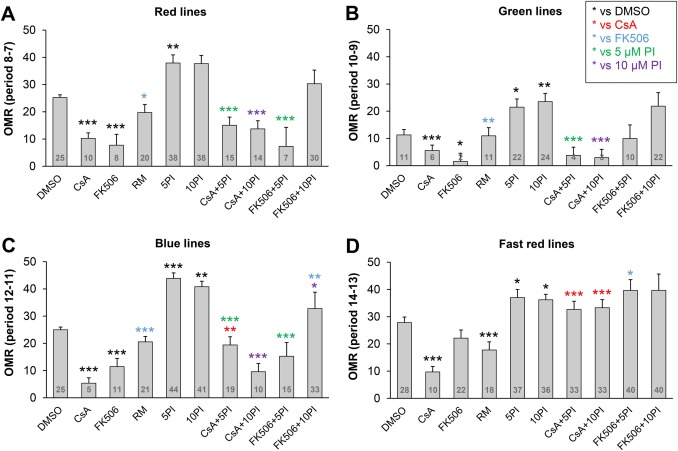
Fig. 5 Fig. 5. Optomotor response (OMR). A) Response to moving red lines. B) Response to moving green lines. C) Response to moving blue lines. D) Response to red lines, moving 16x faster than the moving lines in A-C. Larvae were treated at 5 dpf with DMSO (2 μl/mL), cyclosporine (CsA, 10 μM), tacrolimus (FK506, 1 μM), rapamycin (RM, 1 μM), proINDY (5PI = 5 μM proINDY, 10PI = 10 μM proINDY), or a combination of two treatments. Differences between corresponding groups were examined for significance using a Chi-square test with a Bonferroni correction for multiple comparisons. N = 912, 372, 188, 263, 383, 275, 190, 178, 93 and 86 larvae in the 10 subsequent treatment groups. * p < 0.05/14, ** p < 0.01/14, *** p < 0.001/14.