
|
Figure 4
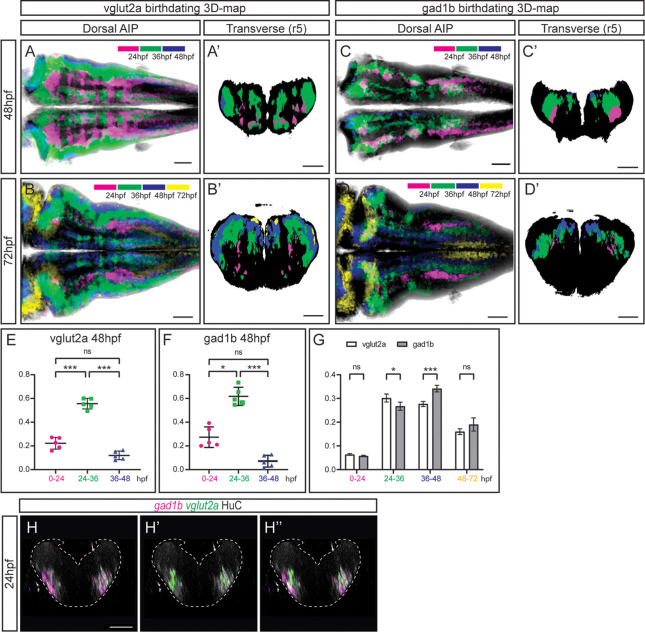
(A–D) Dorsal average intensity projections (AIP) with anterior to the left, and (A–D’) transverse views through r5, of the glutamatergic (A–B) and GABAergic (C–D) 3D-models intersected with the birthdating 3D-map at 48hpf (A, C) and at 72hpf (B, D). vglut2a or gad1b neurons produced before 24hpf, between 24 and 36hpf, between 36 and 48hpf and between 48 and 72hpf are color-coded as indicated. The differentiated domain is depicted in black. (E–F) Dot-plots showing the relative contribution to the corresponding vglut2a/gad1b-neuronal differentiation domains at 48hpf of neurons born at the indicated time intervals. (G) Interleaved bar-plot showing the relative contribution of glutamatergic and GABAergic neurons generated at different time intervals to the vglut2a/gad1b-neuronal differentiation domains at 72hpf, respectively. (E–F) RM one-way ANOVA with Tukey’s multiple comparison test, and (G) two-way ANOVA with Šídák’s multiple comparisons test; p<0.033 (*) p<0.002 (**) p<0.001 (***). (H–H’’) Transverse views of a 24hpf Tg[HuC:GFP] embryo hybridized with vglut2a (green) and gad1b (magenta), and immunostained with HuC (gray). Images are displayed as the overlay of gad1b and HuC (H), vglut2a and HuC (H’), and the merge of the three (H’’). Note that already at 24hpf, there are vglut2a and gad1b cells within the HuC domain. The neural tube contour is depicted with a white dashed line. Scale bar, 50μm.
The temporal registration 3D-atlas can be used as a proxy to reveal the birthdate of the desired neuronal differentiated neurons.