
|
Figure 1
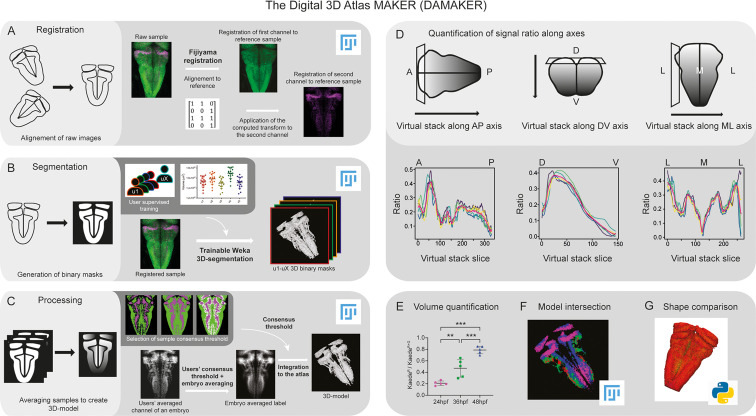
Schematic depiction of sample processing through the digital 3D-atlas making pipeline. (A) For image registration, acquired dual channel images from embryos are registered using the Fijiyama registration plugin in FIJI, the first channel (HuC:GFP signal in green) is aligned to a previously selected HuC signal which serves as reference orientation. The resulting transform file is then used to align the signal of interest (e.g. gad1b:DsRed displayed in magenta). (B) For image segmentation, Tg[HuC:GFP] embryos are used for supervised training of the Trainable Weka 3D-Segmentation algorithm. Images are provided to users, and each user inputs brush strokes on areas with signal and areas considered as background across the stack, in order to obtain a classifier (e.g. a set of filters and thresholds to be used by the algorithm to isolate the signal). Users’ generated classifiers are compared by quantification of a dozen of HuC-signals from various embryos. User classifiers resulting in more than 10% variability among users (ANOVA test) are considered outliers (e.g. u4, user 4) and are not used for sample segmentation. For each embryo, as many 3D-binary masks as user-generated classifiers are created. (C) For processing, 3D-binary masks of a single embryo are averaged to obtain a users’ average segmentation; this allows to assess the interuser segmentation variability and limits the human bias introduced by the supervised training. Signal similarity threshold between users can then be selected (here, consensus among all users was isolated). Users’ average embryo 3D-models of a given condition (n=5) are then averaged together to obtain the embryo’s averaged label. To select sample consensus threshold, we compare embryos’ averaged labels at different thresholds with their negative imprint onto the neuronal differentiation domain. Signal consensus among at least three embryos seems to recapitulate best the original signal, with marginal overlap between the signal and its imprint. Sample consensus threshold is then applied to the embryos’ averaged label to generate the final 3D-model, ready for the integration into the atlas. Several functions can be performed with DAMAKER such as (D) quantification of the signal ratio along body axes by virtually reslicing embryos’ averaged models along the desired axis, (E) quantification of users’ averaged label volumes and display them as a ratio of signal over the neuronal differentiation domain, (F) intersection of the 3D-model integrated in the atlas to assess overlapping or segregation of signals, and (G) analysis of the tissue shape.
Image analysis pipeline (DAMAKER) and digital 3D-atlas construction.