
Figure 7
- ID
- ZDB-IMAGE-221029-82
- Genes
- Publication
- Haynes et al., 2022 - KLC4 shapes axon arbors during development and mediates adult behavior
- All Figures
- Figures for Haynes et al., 2022
|
Figure 7
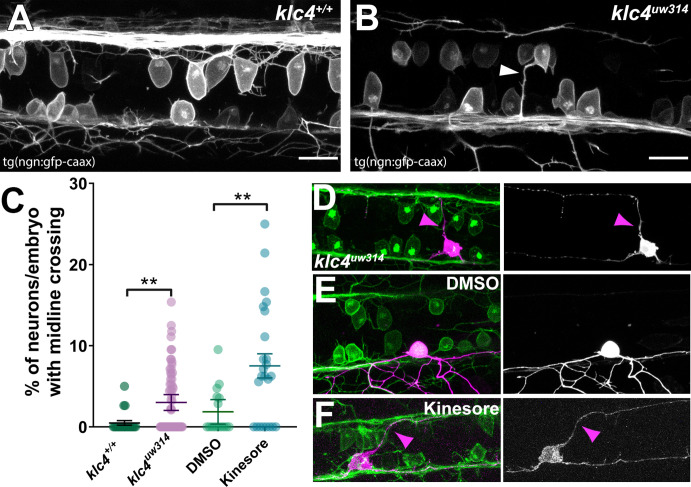
(A–B) Confocal projections (dorsal views) of partial z-stacks containing only the optical sections in the plane of the RB cell bodies within the spinal cord in a wild-type Tg(–3.1ngn1:gfp-caax) embryo (A), or a klc4uw314 Tg(–3.1ngn1:gfp-caax) embryo (B), with an apical protrusion from a neuron crossing the midline and reaching the contralateral side (white arrowhead). Scale bars = 20 µm. (C) The percentage of neurons per embryo that had an apical protrusion crossing the midline of the spinal cord was quantified. **p<0.0052, Mann–Whitney test. Mean with SEM displayed over individual data points. Wild type N=608 neurons from 21 embryos, klc4uw314 N=1496 neurons from 47 embryos, 2% DMSO N=429 neurons from 15 embryos, Kinesore N=595 neurons from 21 embryos. (D–F) Mosaic labeling of individual neurons by injection with –3.1ngn1:gfp-caax DNA into klc4uw314 mutants (D), DMSO-treated embryos I or kinesore-treated embryos (F) showing that apical protrusions (magenta arrowheads) can fasciculate onto the contralateral central axon.
Midline crossing of apical protrusions occurs more frequently when KLC function is disrupted.