
Image
|
Figure Caption
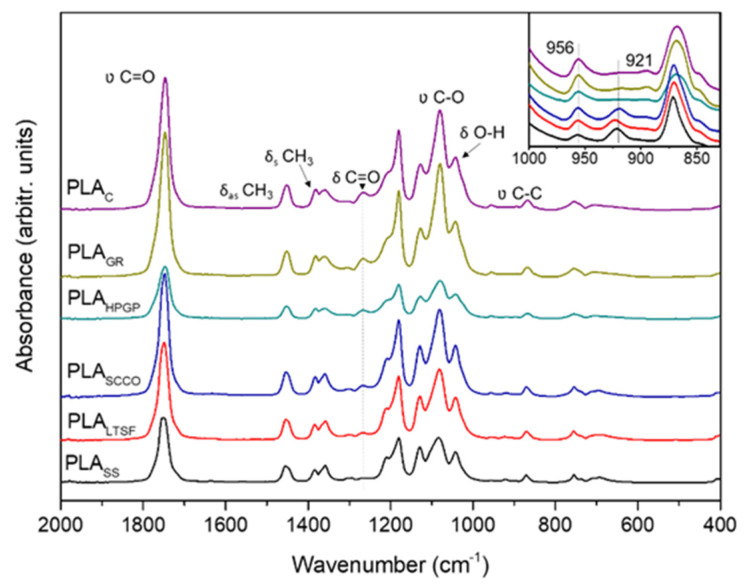
Figure 3
FTIR spectra of the PLA discs subjected to the different sterilisation treatments with absorption bands identified: PLAGR, PLASCCO, PLALTSF, PLASS and PLAHPGP together with the untreated PLA disc as control, PLAC. Amplification of the 400–2000 cm−1 wavenumber range in the inset with the two main peaks identified.
Acknowledgments
This image is the copyrighted work of the attributed author or publisher, and
ZFIN has permission only to display this image to its users.
Additional permissions should be obtained from the applicable author or publisher of the image.
Full text @ Polymers (Basel)