
Figure 2.
- ID
- ZDB-IMAGE-221018-171
- Publication
- Jimenez et al., 2022 - A regulatory network of Sox and Six transcription factors initiate a cell fate transformation during hearing regeneration in adult zebrafish
- All Figures
- Figures for Jimenez et al., 2022
|
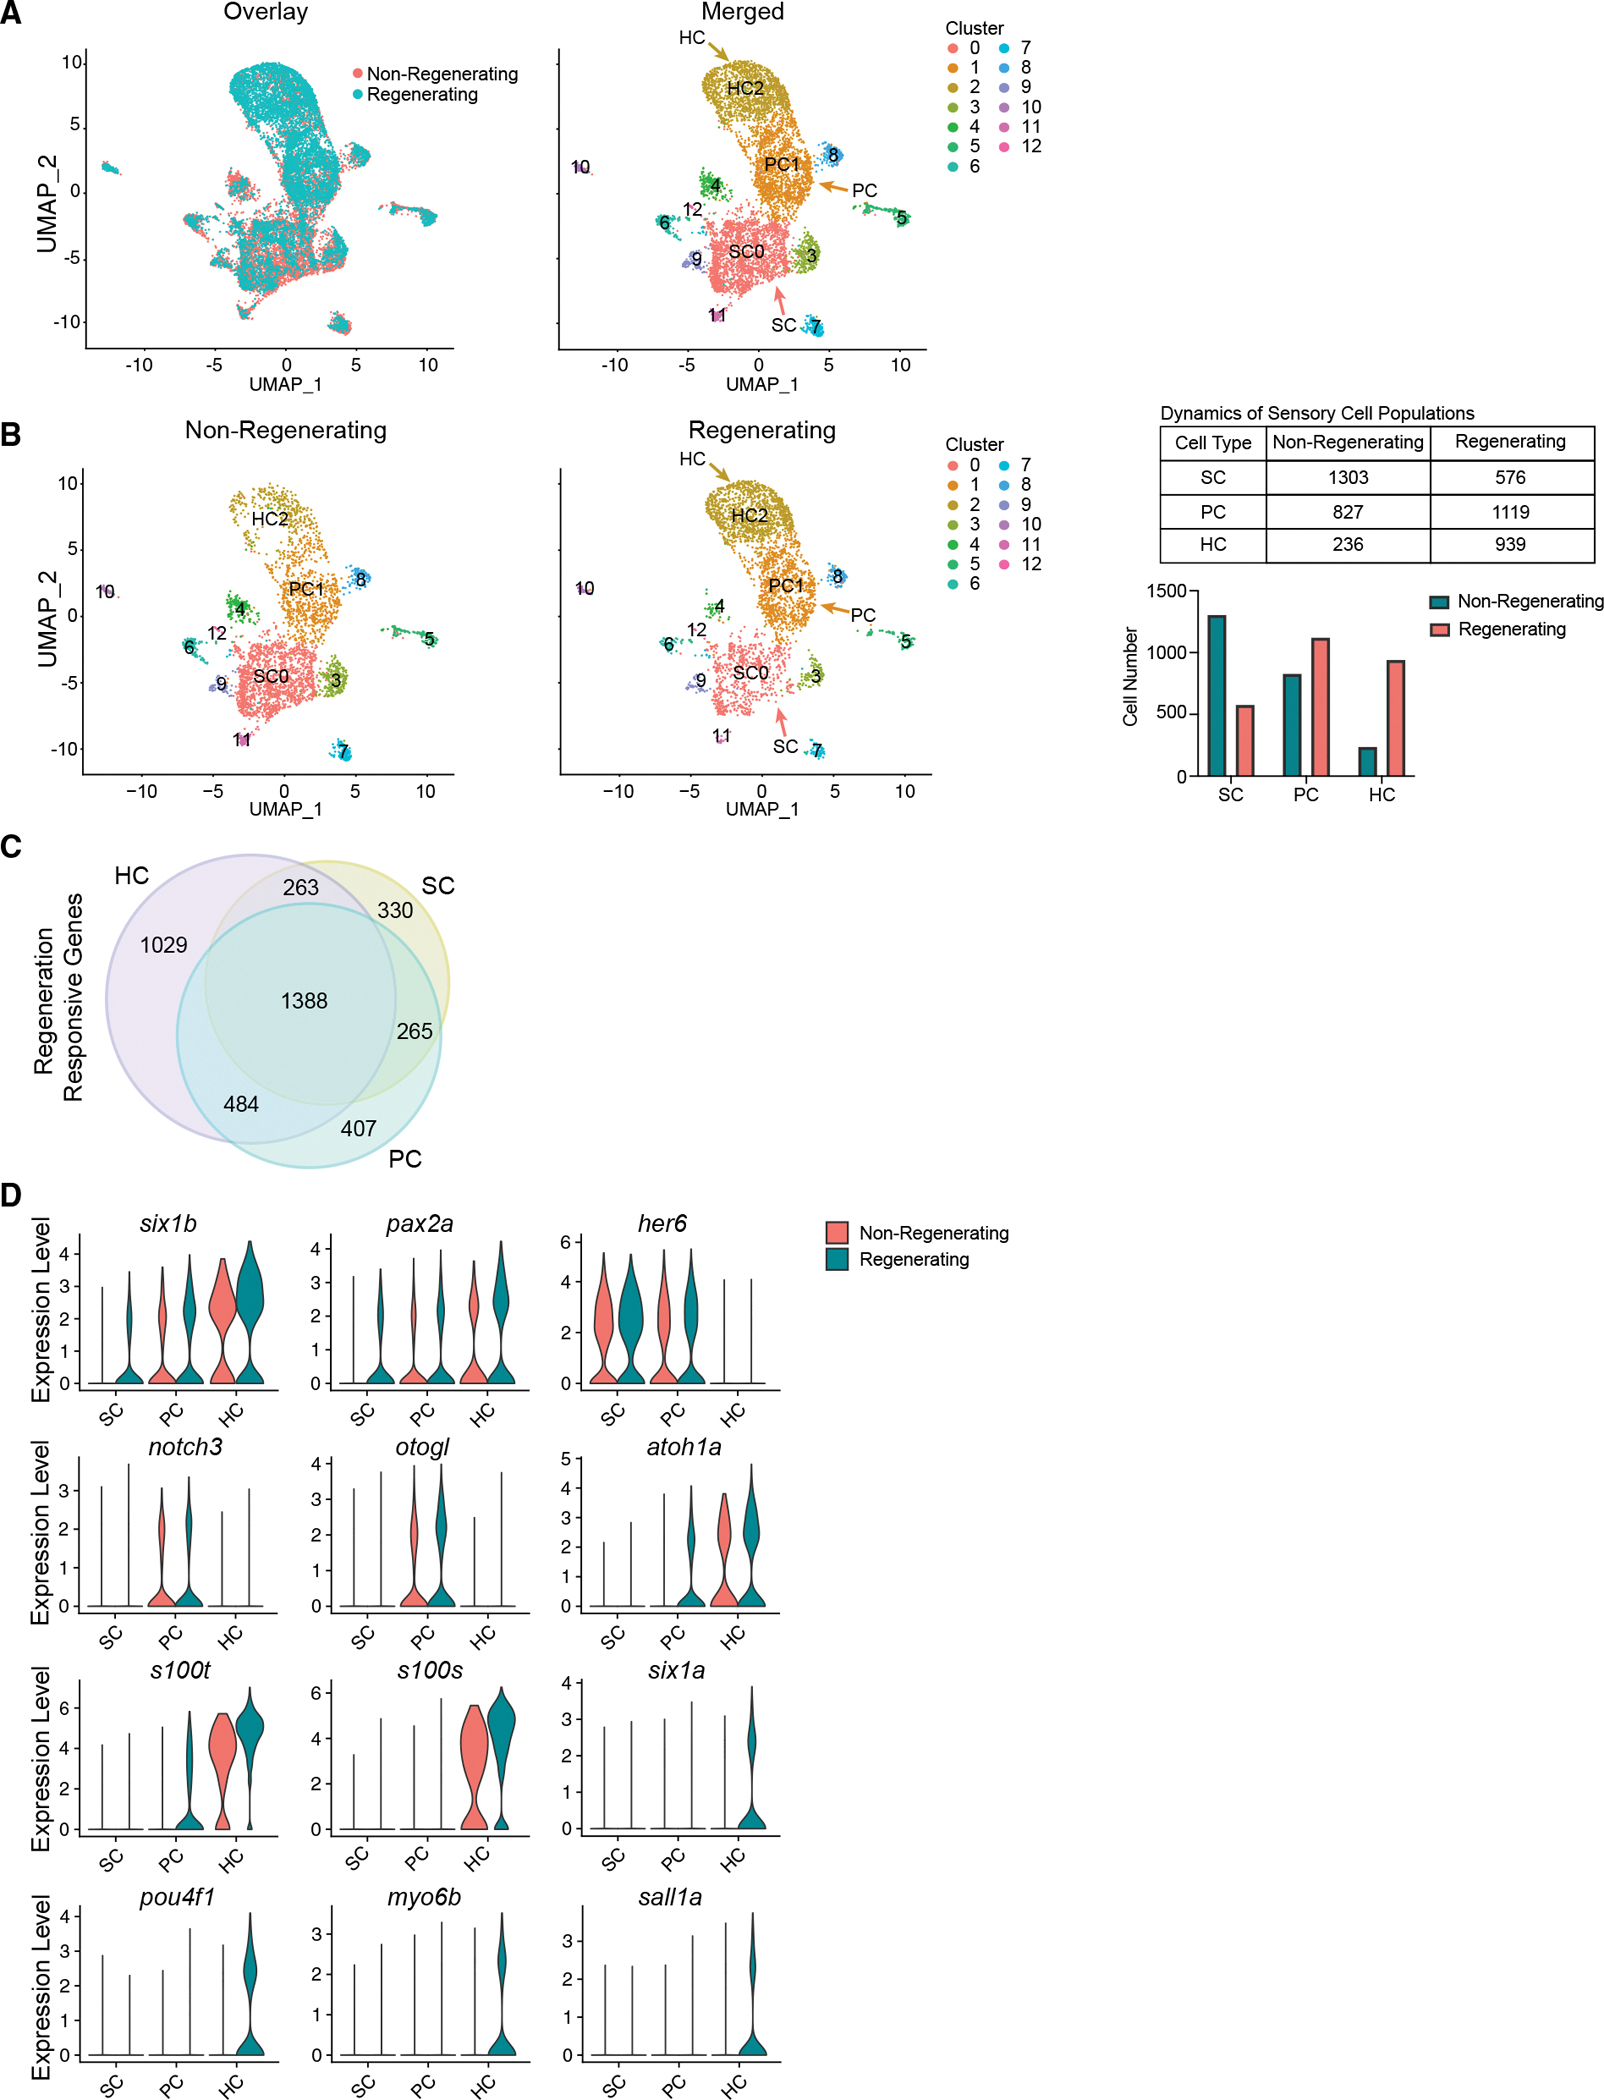
Figure 2.
Cell-type-specific gene expression and expansion of HC lineage populations during regeneration
(A) Left: UMAP showing overlay of inner ear cells between non-regenerating and regenerating sensory epithelia. Colors distinguish conditions. Right: UMAP of cells across conditions grouped together based on gene expression, detecting 13 cell populations. Cluster 0 consists of SCs (SC0). Cluster 1 consists of PCs (PC1). Cluster 2 consists of HCs (HC2).
(B) Left: UMAP plots of non-regenerating and regenerating conditions side-by-side. The colors distinguish clusters labeled in (A). Middle: UMAP of 3,670 randomly sampled single cells from non-regenerating controls (pooled wild-type, untreated Tg(myo6b:hDTR), and wild-type fish injected with DT). UMAP of 3,330 randomly sampled single cells from regenerating samples on days 4, 5, and 7 post injection. Samples include saccules and utricles. Right: table and bar graph of cell numbers in non-regenerating and regenerating SCs, PCs, and HCs.
(C) Venn diagram showing overlapping and unique differentially expressed genes in HCs, SCs, and PCs.
(D) Violin plots showing the distribution of gene expression of top genes identified with differential expression testing across cell types (p < 0.01; FC ≥ 0.25).