
|
Fig. 5
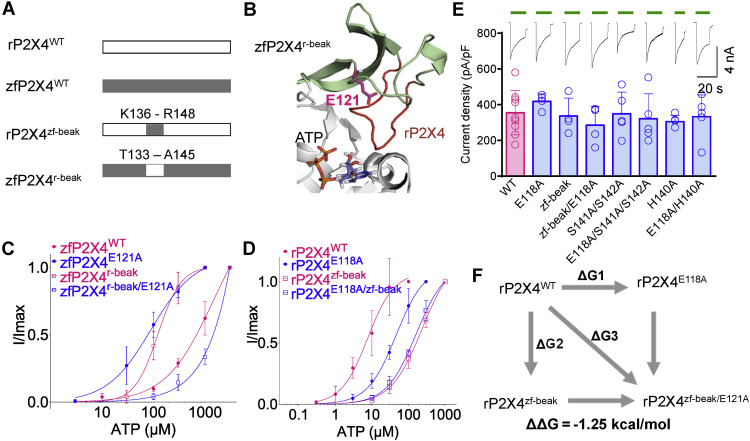
Figure 5. The role of E118 in the apparent affinity of ATP correlates with the sequence of the beak region in rP2X4. A, chimera construction of rP2X4 and zfP2X4. B, zoom-in view of the head and beak regions of the chimera zfP2X4r-beak (homology model). The beak region of zfP2X4 (pale green) is replaced by equivalent residues of rP2X4 (red). C and D, concentration–response curves of ATP in zfP2X4 WT and mutant receptors (C) and rP2X4 WT and mutant receptors (D). The solid lines are fitted by Hill equation (mean ± SEM, n = 3–6, EC50 = 232.3 ± 50.3 and 161.7 ± 26.5 μM, nH = 1.02 ± 0.11 and 1.07 ± 0.11 for rP2X4zf-beak and rP2X4zf-beak/E118A, respectively). The data of zfP2X4WT, zfP2X4E121A, rP2X4WT, and rP2X4E118A are the same as those shown in Figure 3, A and B and are shown here as controls. E, representative current traces and pooled data for rP2X4 WT and mutant receptors. The scatter of each open circle represents each measurement, n = 9, 4, 4, 4, 5, 5, 5, and 5, from left to right, respectively. One-way ANOVA with Bonferroni post-test (F(7, 33) = 0.5623; p = 0.7807). F, double-mutant cycle between E118 and the beak region of rP2X4. rP2X4, rat (Rattus norvegicus) P2X4; zfP2X4, zebrafish (Danio rerio) P2X4.