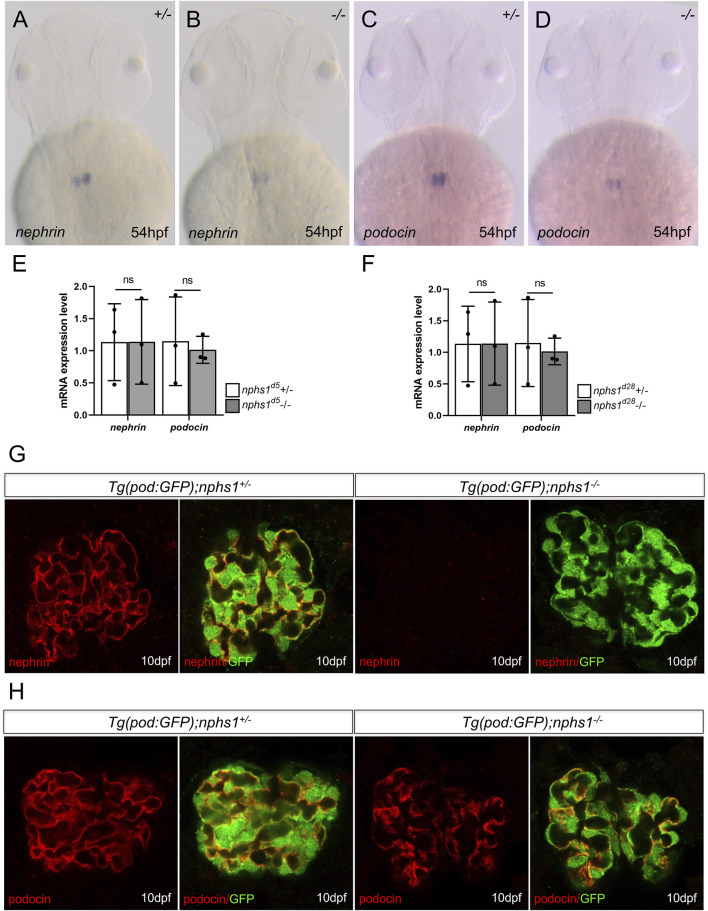
The expression analyses of nephrin and podocin in nphs1 mutants. Whole-mount in situ hybridization for nephrin (A–B) and podocin (C–D) at 54 hpf (E–F) Quantitative PCR analyses of mRNA levels of nphs1 and nphs2 show no statistically significant difference between nphs1 heterozygotes (+/-) and nphs1 homozygous mutants (-/-) at 7 dpf for both 5bp deletion (d5) and 28bp deletion (d28) mutant alleles. The expression level is normalized to that of eflα. The error bars show the standard error of the mean (SEM). (G–H) Confocal images of Immunofluorescence staining for nephrin (G, red) and podocin (H, red) at 10 dpf. Podocytes are marked by GFP expression (green) by the Tg (pod:GFP) transgene. No nephrin expression is detected in Tg (pod:GFP); nphs1-/- at 10 dpf, while podocin is present with a grainy pattern.
This image is the copyrighted work of the attributed author or publisher, and
ZFIN has permission only to display this image to its users.
Additional permissions should be obtained from the applicable author or publisher of the image.
Full text @ Front Cell Dev Biol
Your Input Welcome
Thank you for submitting comments. Your input has been emailed to ZFIN curators who may contact you if
additional information is required.
Oops. Something went wrong. Please try again later.