
Image
|
Figure Caption
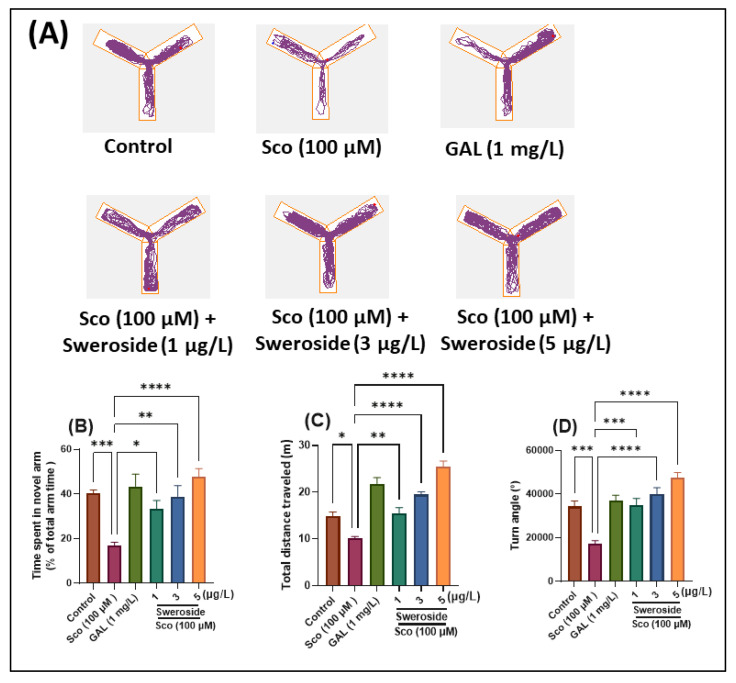
Fig. 2
Assessment of response to novelty in Sco-treated zebrafish subjected to sweroside treatment at doses of 2.79, 8.35, and 13.95 nM in the Y-maze test. (A) Representative tracking locomotion patterns in various groups; (B) Time spent in the novel arm (% of total arm time); (C) Total distance traveled (m); (D) Turn angle (°). Data are presented as means ± S.E.M. (n = 10 animals per group). * p < 0.01, ** p < 0.001, *** p < 0.0001, and **** p < 0.00001 (Tukey’s post hoc analyses). Galantamine (GAL, 2.71 μM) was used as a reference positive drug.
Figure Data
Acknowledgments
This image is the copyrighted work of the attributed author or publisher, and
ZFIN has permission only to display this image to its users.
Additional permissions should be obtained from the applicable author or publisher of the image.
Full text @ Molecules