
Image
|
Figure Caption
Fig. 2
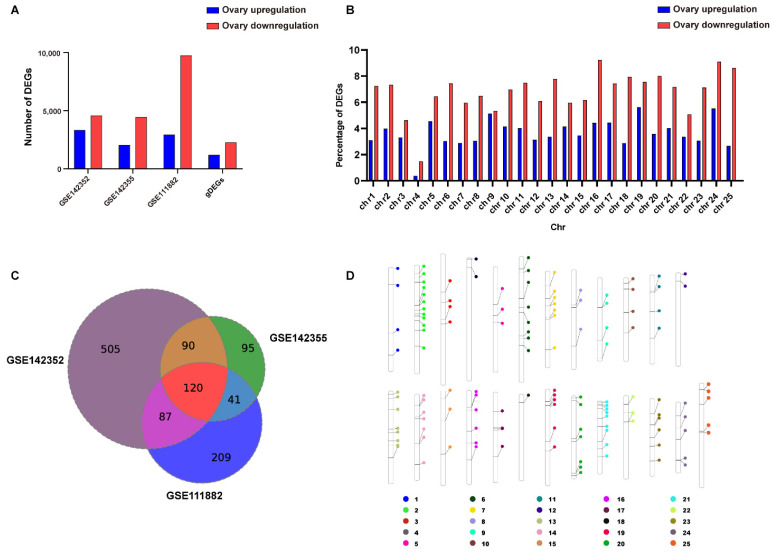
Number of DEGs and DASGs in zebrafish and chromosome distribution profile for clusters of gDEGs and gDASGs (A) Bar graph representing the statistics of DEGs highly expressed in ovary and testis respectively. (B) Relative chromosome distributions in percentages of gDEGs in testis and ovary. (C) Venn diagram of DASGs at different datasets. (D) Distribution of gDASGs on chromosomes.
Acknowledgments
This image is the copyrighted work of the attributed author or publisher, and
ZFIN has permission only to display this image to its users.
Additional permissions should be obtained from the applicable author or publisher of the image.
Full text @ Life (Basel)