
Image
|
Figure Caption
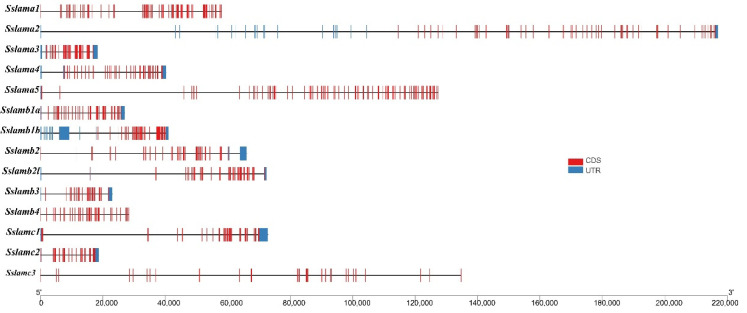
Fig. 4
Gene structures of 14 laminin genes. The black solid line represents the intron region. The blue rectangle represents the UTR region, and the red rectangle represents the exon region.
Acknowledgments
This image is the copyrighted work of the attributed author or publisher, and
ZFIN has permission only to display this image to its users.
Additional permissions should be obtained from the applicable author or publisher of the image.
Full text @ Int. J. Mol. Sci.