IMAGE

Fig. 3

ID
ZDB-IMAGE-220921-134
Source
Figures for Andreassen et al., 2022
Image
Figure Caption

Fig. 3

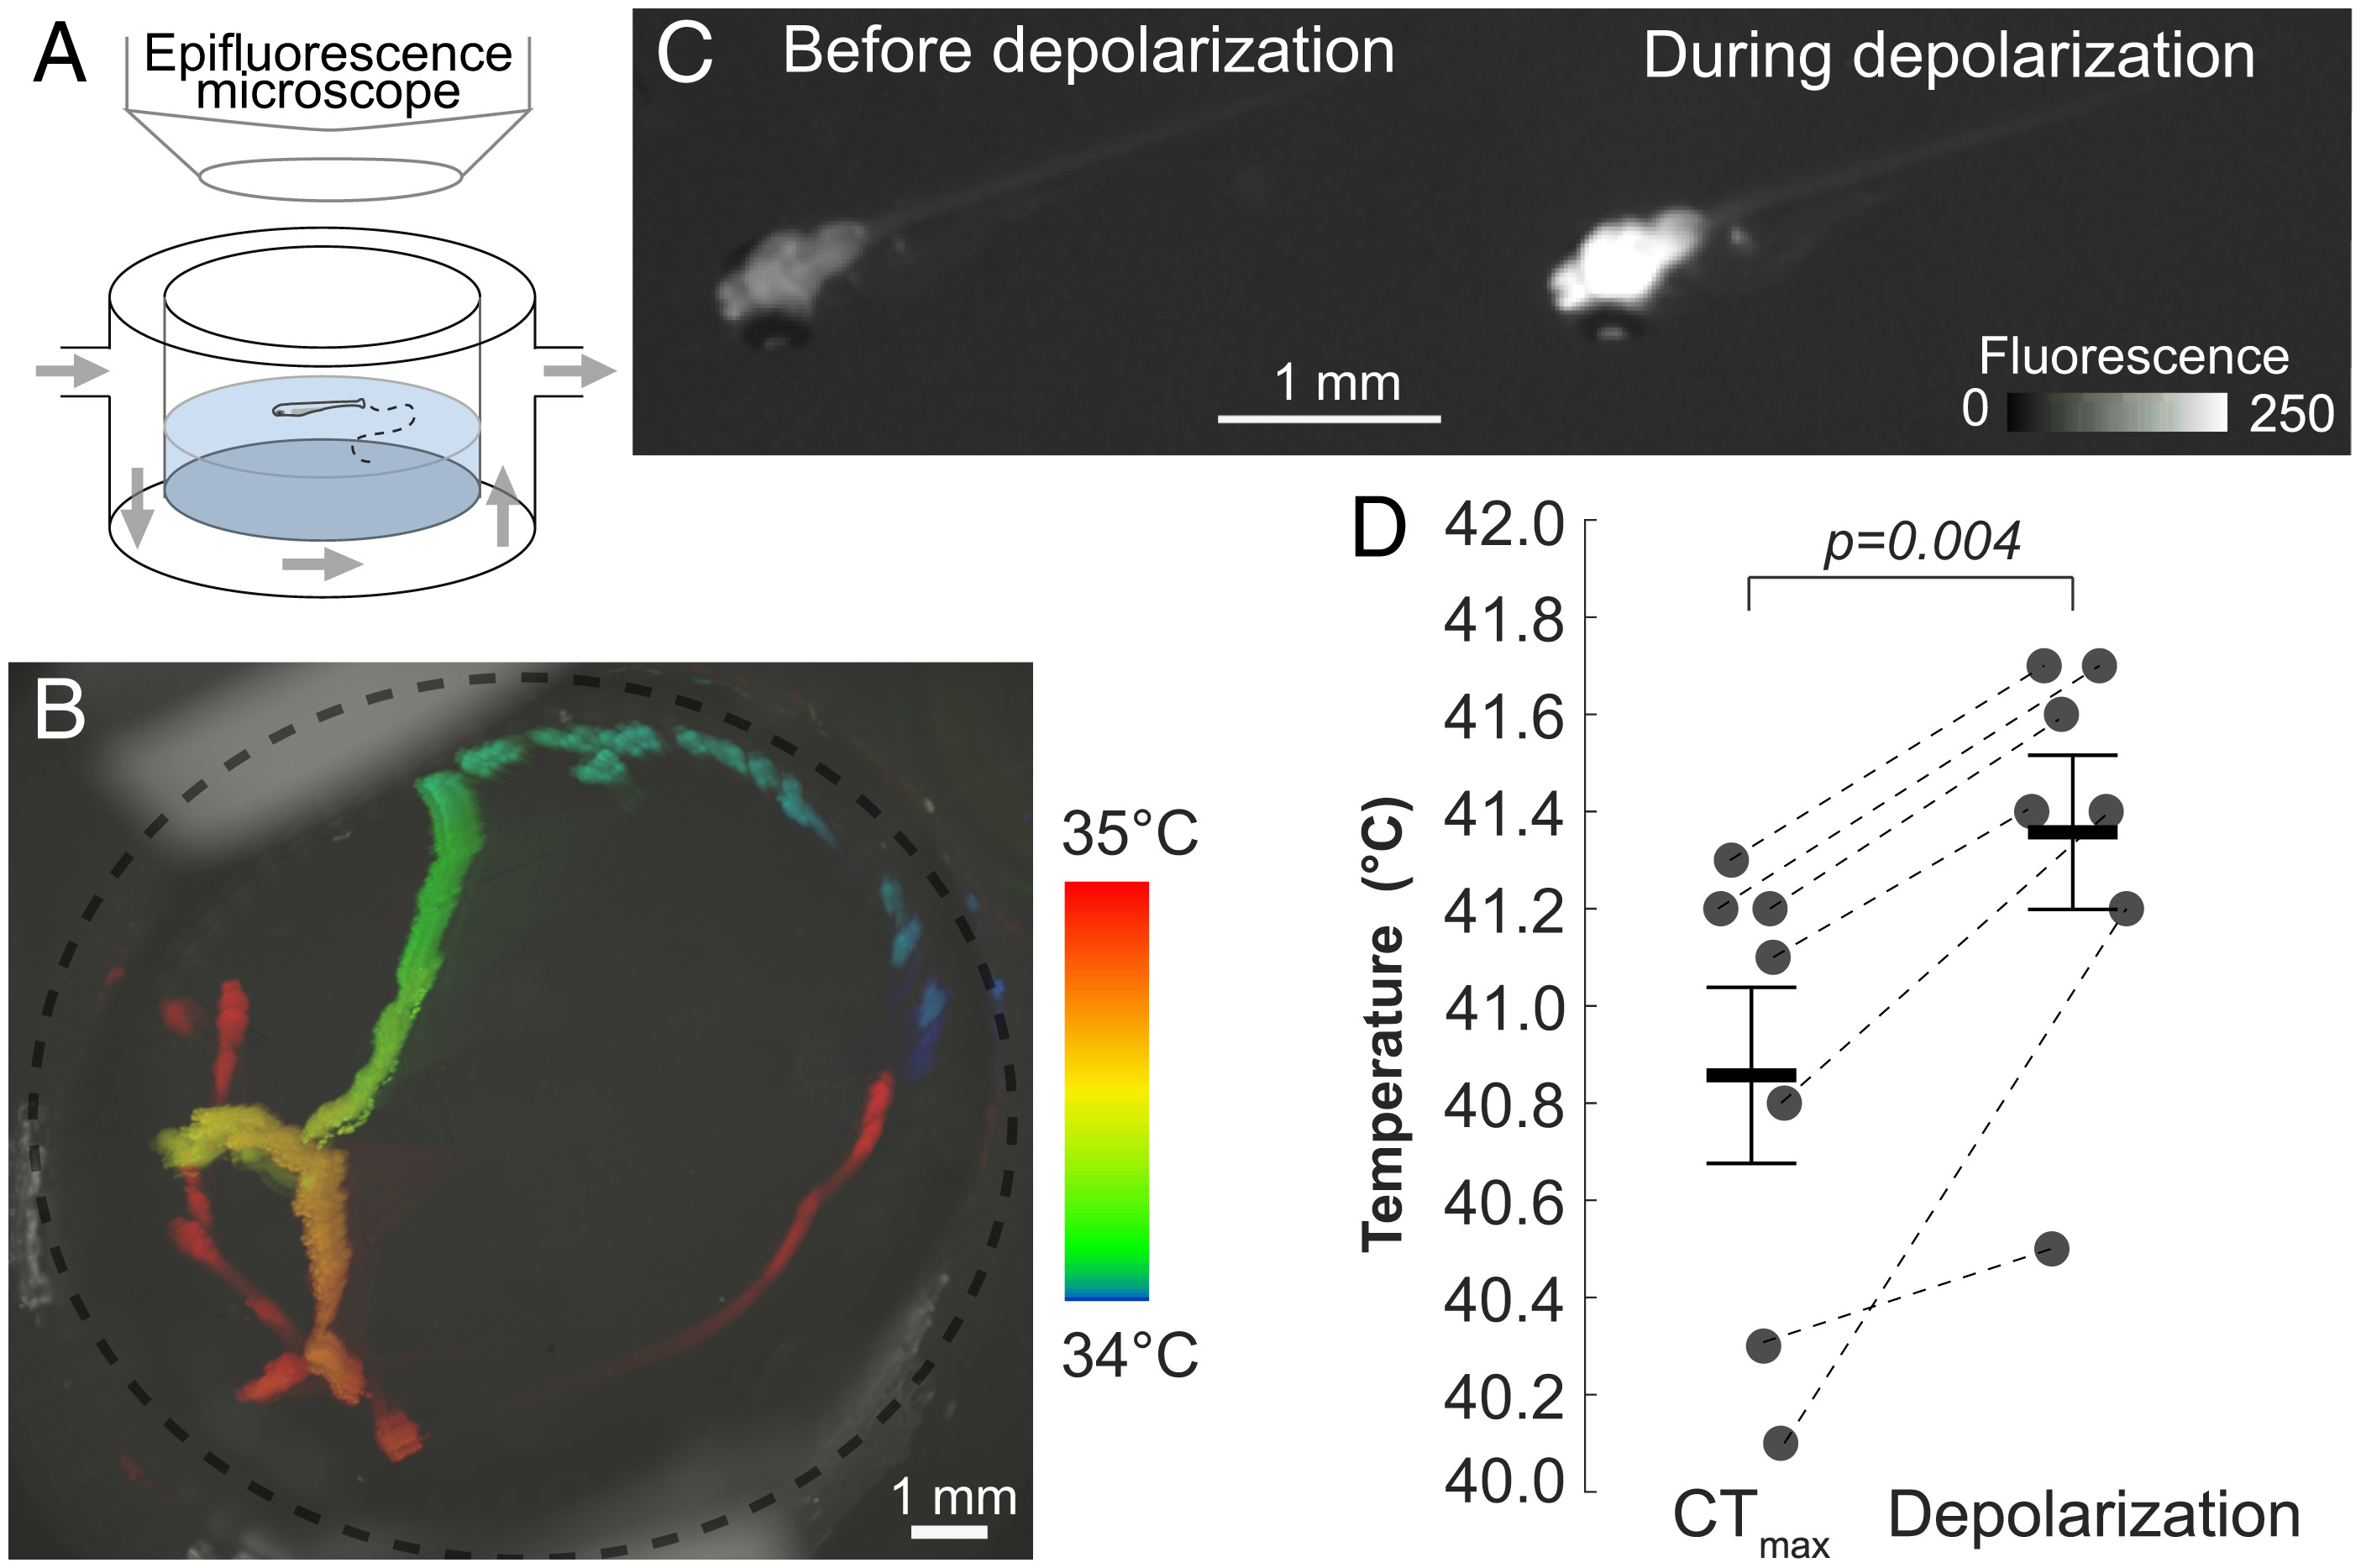
CTmax precedes the brain-wide depolarization in freely swimming zebrafish larvae. (A) Schematic overview of the experimental setup for calcium imaging in freely swimming, 5-d-old Tg(elavl3:GCaMP6s) zebrafish larvae. (B) Top view of setup with color-coded time projection of a heat-ramp fish?s movements in the setup for 3 min (34 to 35 °C). (C) Representative images of brain fluorescence in the same fish as in B, before (Left) and during (Right) the brain-wide depolarization. (D) CTmax and depolarization-onset temperatures measured in heat-ramp fish (black circles; n = 7) (SI Appendix, Table S5). The bars and error bars indicate the mean and SE.

Acknowledgments
This image is the copyrighted work of the attributed author or publisher, and ZFIN has permission only to display this image to its users. Additional permissions should be obtained from the applicable author or publisher of the image. Full text @ Proc. Natl. Acad. Sci. USA