
Image
|
Figure Caption
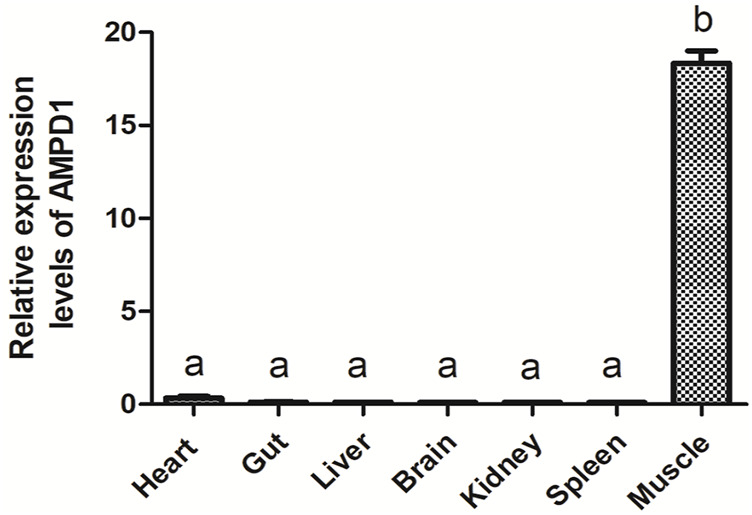
FIGURE 3
The relative expression levels of AMPD1 gene in different tissues of triploid crucian carp were analyzed by real-time fluorescence quantitative PCR. Error bars represent the means ± SD;
Acknowledgments
This image is the copyrighted work of the attributed author or publisher, and
ZFIN has permission only to display this image to its users.
Additional permissions should be obtained from the applicable author or publisher of the image.
Full text @ Front. Physiol.