IMAGE

Figure 4

ID
ZDB-IMAGE-220914-16
Source
Figures for Li et al., 2022
Image
Figure Caption

Figure 4

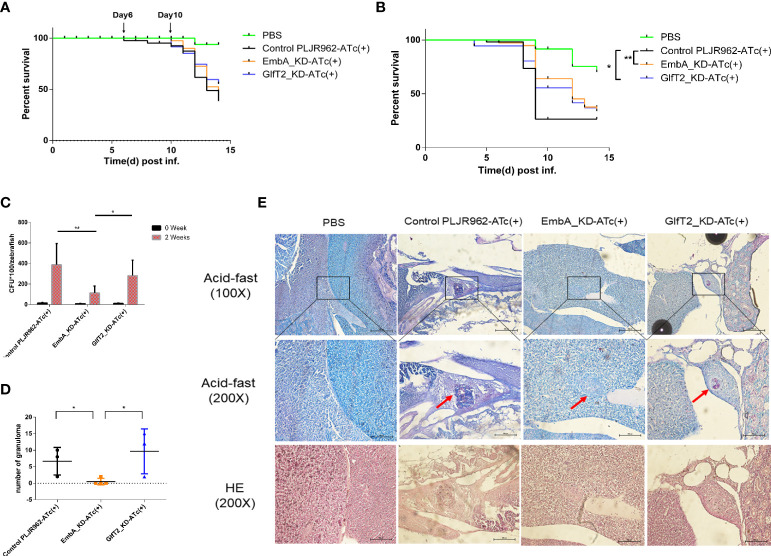
Zebrafish infection model with EmbA/GlfT2_KD strains. (A, B) Survival curves of larvae zebrafish infected by control PLJR962 strain and EmbA/GlfT2_KD strains with initial colony forming unit (CFU) = 100 or 300, respectively (n = 20–50). Log-rank tests are used to test the significance of the Kaplan–Meier survival curves: *P < 0.05, **P < 0.01. (C, D) CFU counts and the granuloma numbers in adult zebrafish infected by control strain and EmbA/GlfT2 knock-down strains, respectively, at 2 weeks post-injection. Data were plotted as mean ± SD. Two-way analysis of variance tests were used for all significance analysis: *P < 0.05 and **P < 0.01. (E) Acid-fast staining and hematoxylin and eosin (H&E) staining of zebrafish sections. Acid-fast staining was observed with an optical microscope at ×100 and ×200, and the visual field of H&E stain was the corresponding area of acid-fast staining at ×200 magnification. The red arrow points to the granuloma, and the purplish red color in the center of acid-fast granuloma represents the thallus.

Figure Data
Acknowledgments
This image is the copyrighted work of the attributed author or publisher, and ZFIN has permission only to display this image to its users. Additional permissions should be obtained from the applicable author or publisher of the image. Full text @ Front Immunol