
Fig. 7
- ID
- ZDB-IMAGE-220913-7
- Publication
- Shrestha et al., 2022 - Embryonic Hyperglycemia Delays the Development of Retinal Synapses in a Zebrafish Model
- All Figures
- Figures for Shrestha et al., 2022
|
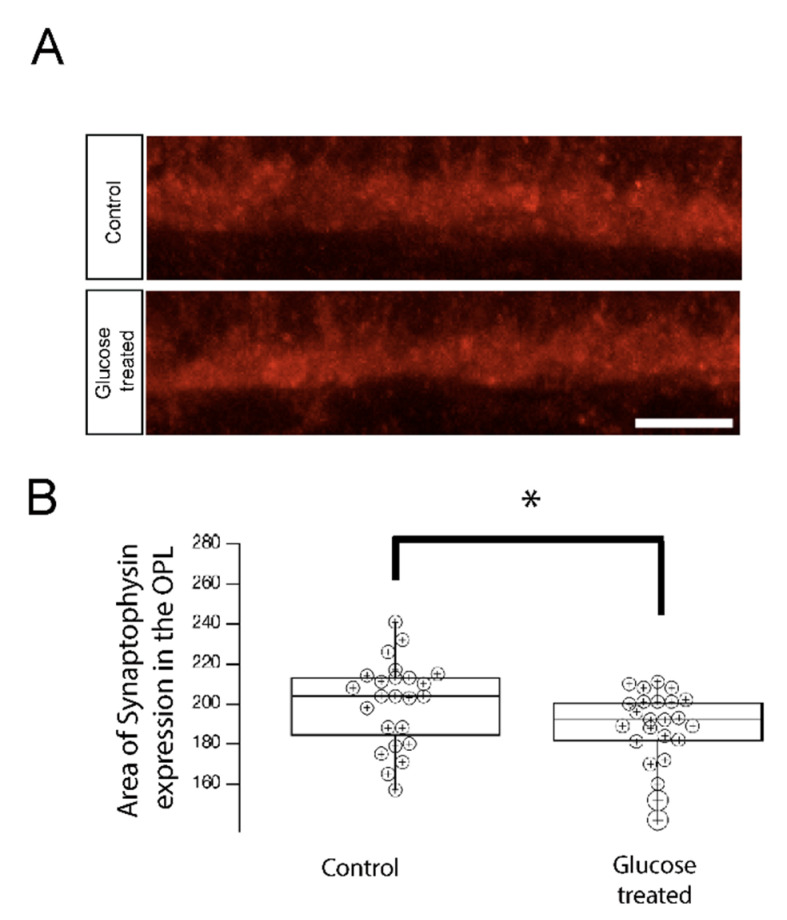
Fig. 7
Synaptophysin accumulation in the OPL is reduced in 5 dpf hyperglycemic larvae. (A) Transverse retinal sections from 5 dpf control and hypoglycemic larvae were immunostained with fluorescently labeled antibodies specific for the synaptic vesicle marker synaptophysin. Maximal intensity projections are shown. Scale bar, 5 µm. Synaptophysin accumulation was reduced in hyperglycemic larvae relative to that in control larvae. (B) Quantitative analyses of IHC for synaptophysin accumulation in control and hyperglycemic larvae are indicated by box-and-whisker plots. Boxes indicate median value ranges, while whiskers indicate 5th–95th percentile values. Data represent the average value of the area of expression in 6–9 animals obtained from 3–5 independent experiments we sampled per condition, shown as individual data points. Scale bar, 5 µm. * p < 0.05; two-tailed t-test. Abbreviations used: dpf, days post-fertilization; SEM, standard error of the mean.