
Fig. 4
- ID
- ZDB-IMAGE-220913-4
- Publication
- Shrestha et al., 2022 - Embryonic Hyperglycemia Delays the Development of Retinal Synapses in a Zebrafish Model
- All Figures
- Figures for Shrestha et al., 2022
|
Fig. 4
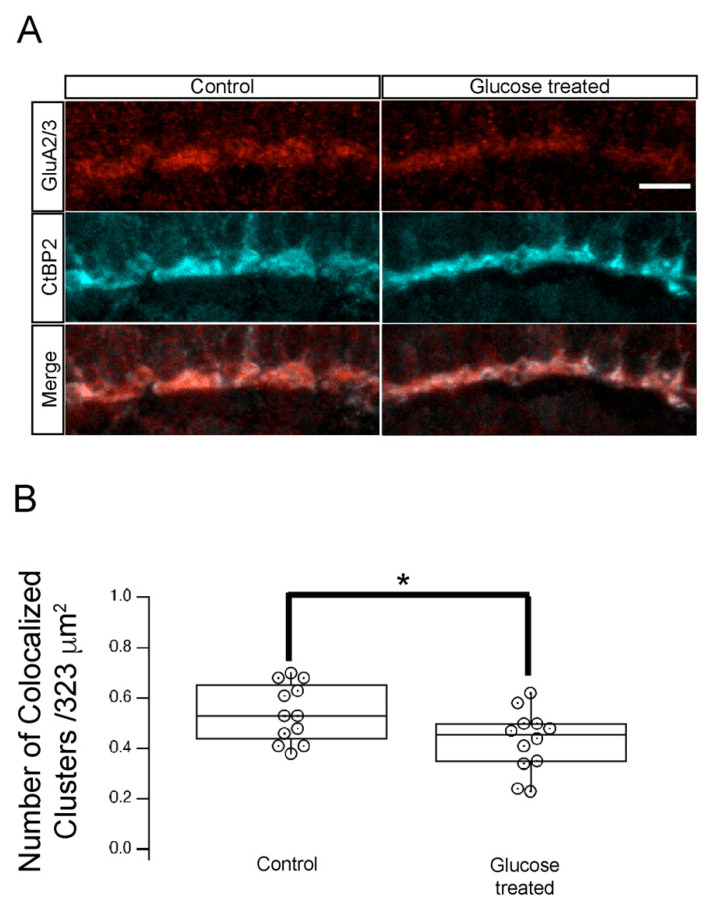
Hyperglycemia altered the synapse between photoreceptor and GluR2/3-containing neurons in the retinal INL. (A) Transverse retinal sections from 5 dpf control (left panels) and hyperglycemic (right panels) larvae were immunostained with fluorescently labeled antibodies specific for CtBP2 (red, top) or GluR2/3 (cyan, middle); overlays of CtBP2 and GluR2/3 signals are shown (merge; bottom). Maximal intensity projections are shown. Scale bar, 5 µm. We observed co-localization of ribeye/CtBP2 and GluR2/3 proteins in the OPL. (B) Quantitative analyses of IHC for CtBP2 and GluR2/3 in the OPL shown by box-and-whisker plots that indicate the number of colocalized clusters from control and hyperglycemic larvae. Scale bar, 5µm. Boxes indicate interquartile ranges, while whiskers indicate range of maximal and minimal values. Data are presented as mean values ± SEM. * p < 0.05. Abbreviations used: CtBP2, C-terminal binding protein 2; dpf, days post-fertilization; GluR2/3, glutamate receptor 2/3; INL, inner nuclear layer; OPL, outer plexiform layer.