
Fig. 3
- ID
- ZDB-IMAGE-220913-3
- Publication
- Shrestha et al., 2022 - Embryonic Hyperglycemia Delays the Development of Retinal Synapses in a Zebrafish Model
- All Figures
- Figures for Shrestha et al., 2022
|
Fig. 3
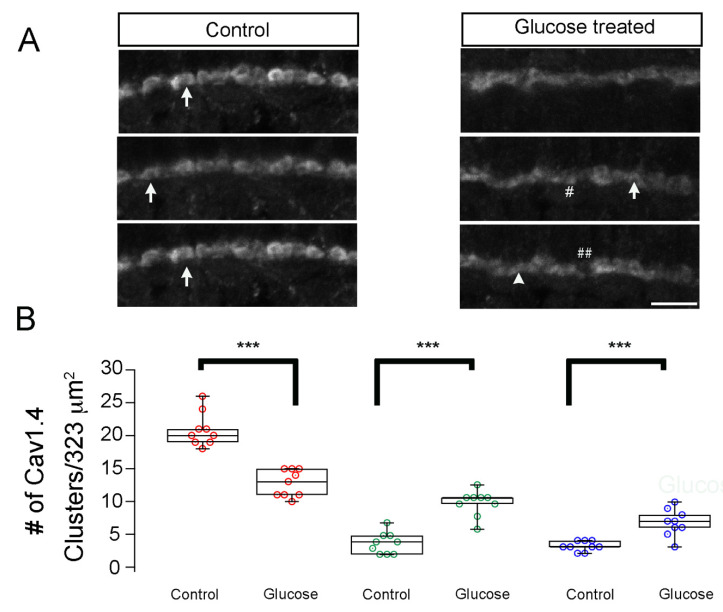
Hyperglycemia leads to developmental changes in Cav1.4/cacna1f accumulation in the OPL of zebrafish larvae. (A) Transverse retinal sections from 5 dpf control (left) and hyperglycemic (right) larvae immunostained with fluorescently labeled antibodies specific for Cav1.4/cacna1f. Maximal intensity projections are shown. Mature (elongated, arrow) and immature (ellipsoid, closed arrows or spherical, #) ribbon morphologies are indicated. ## Denotes the gaps between Cav1.4 proteins. Scale bar, 5 µm. (B) Quantitative analyses of IHC for Cav1.4/cacna1f were performed similarly for ribeye/CtBP2 and were categorized according to morphology, as described in Materials and Methods: mature (elongated, red) and immature (ellipsoid, green or spherical, blue) morphologies were noted and are shown as box-and-whisker plots. Boxes show all values, while whiskers indicate minimum and maximum values. Data are presented as mean values ± SEM. *** p < 0.001. Abbreviations: Cav1.4/cacna1f, voltage-dependent calcium channel; dpf, days post-fertilization; IHC, immunohistochemistry; SEM, standard error of the mean.