
Fig. 2
- ID
- ZDB-IMAGE-220913-2
- Publication
- Shrestha et al., 2022 - Embryonic Hyperglycemia Delays the Development of Retinal Synapses in a Zebrafish Model
- All Figures
- Figures for Shrestha et al., 2022
|
Fig. 2
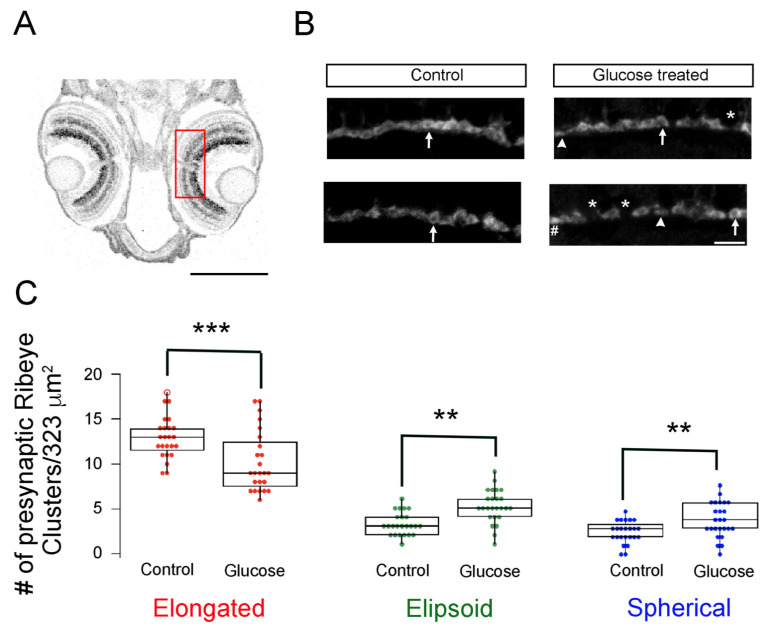
The maturation of synaptic ribbons is delayed in hyperglycemic zebrafish larvae. (A) Imaging region of the retina is illustrated with a ROI (red) placed on the transverse section of 5 dpf larvae. Scale bar, 200 μm; (B) Maximal intensity projection of confocal z-stacks of retinal sections from control (left panels) and hyperglycemic larvae (right panels) immunostained with fluorescently labeled antibodies specific for ribeye/CtBP2. Mature (elongated, arrow) and immature (ellipsoid, arrowhead or spherical, #) ribbon morphologies are indicated. * Denotes the gaps between ribbons. Scale bar, 5 μm; (C) Quantitative analyses of ribbon morphologies in retinal sections stained for ribeye/CtBP2 were categorized according to morphology, as described in Materials and Methods: mature (elongated, red) and immature (ellipsoid, green or spherical, blue) morphologies were noted and are shown as box-and-whisker plots. Boxes show all values, while whiskers indicate minimum and maximum values. Data are presented as mean values ± SEM. The total number of profiles examined was 521 control larvae and 388 glucose-treated larvae in groups of 50 larvae; the retinas from each of the larvae were processed independently. ** p < 0.01; *** p < 0.001. Abbreviations: CtBP2, C-terminal binding protein 2; dpf, days post-fertilization; ROI, region of interest; SEM, standard error of the mean.