
Fig. 2
- ID
- ZDB-IMAGE-220819-12
- Genes
- Publication
- Wu et al., 2022 - dock8 deficiency attenuates microglia colonization in early zebrafish larvae
- All Figures
- Figures for Wu et al., 2022
|
Fig. 2
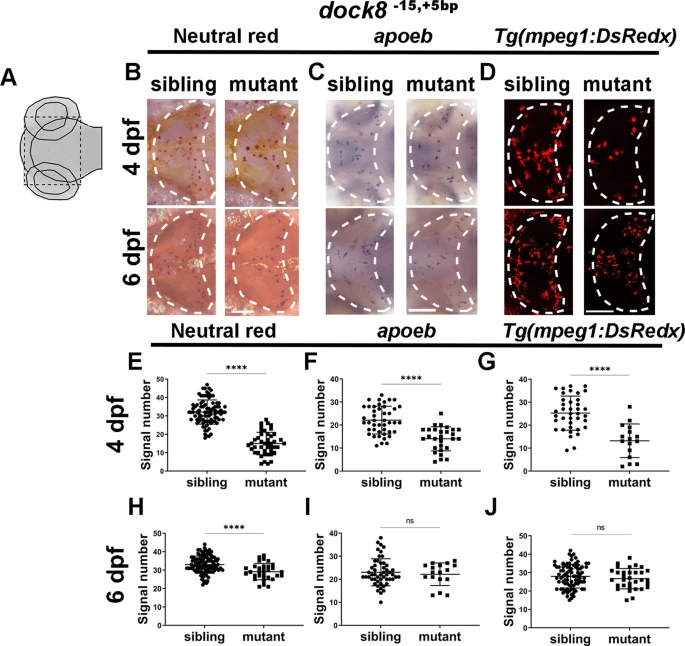
A Schematic diagram of the imaging region. Black dash lines represent the imaging area. B, E, H Representative images (B) and quantification of 4 dpf (E) and 6 dpf (H) NR signals of dock8-15,+5bp mutants and siblings. C, F, I Representative images (C) and quantification of 4 dpf (F) and 6 dpf (I) apoeb WISH signals of dock8-15,+5bp mutants and siblings. D, G, J Representative images (D) and quantification of 4 dpf (G) and 6 dpf (J) mpeg1-dsredx positive cells in optic tectum of dock8-15,+5bp mutants and siblings. Group sizes were at least n = 30 zebrafish embryos. Each dot represents one larva. White dashed lines indicate the optic tectum. Scale bar = 100 µm. Data were analyzed by unpaired Student’s t-tests. nsP > 0.05;****P ≤ 0.0001.