
Image
|
Figure Caption
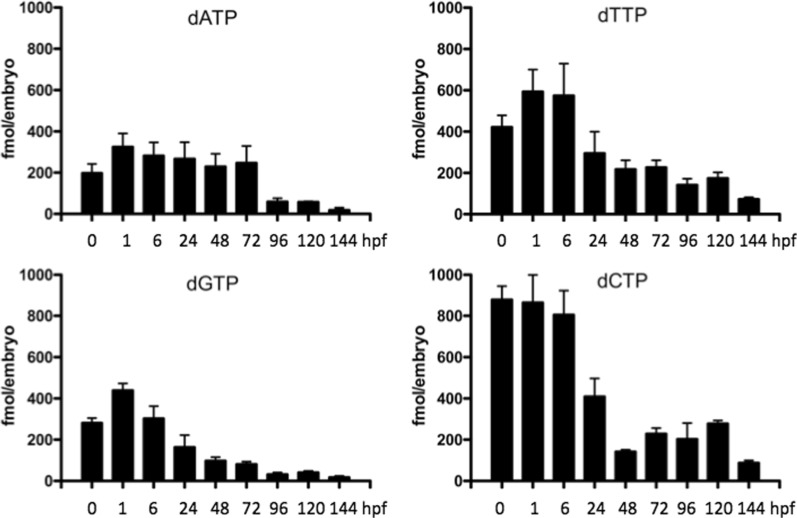
Fig. 1
The levels of dNTPs at different developmental stages. A total of 50–75 embryos/larvae were collected at each time point and used in dNTP measurement (see Materials and Methods for details). Data were from 9 to 12 independent measurements and given as fmol dNTP per embryo (mean ± SD)
Acknowledgments
This image is the copyrighted work of the attributed author or publisher, and
ZFIN has permission only to display this image to its users.
Additional permissions should be obtained from the applicable author or publisher of the image.
Full text @ BMC Neurosci.