
Fig. 6
- ID
- ZDB-IMAGE-220802-40
- Publication
- Wang et al., 2022 - Ifi30 Is Required for Sprouting Angiogenesis During Caudal Vein Plexus Formation in Zebrafish
- All Figures
- Figures for Wang et al., 2022
|
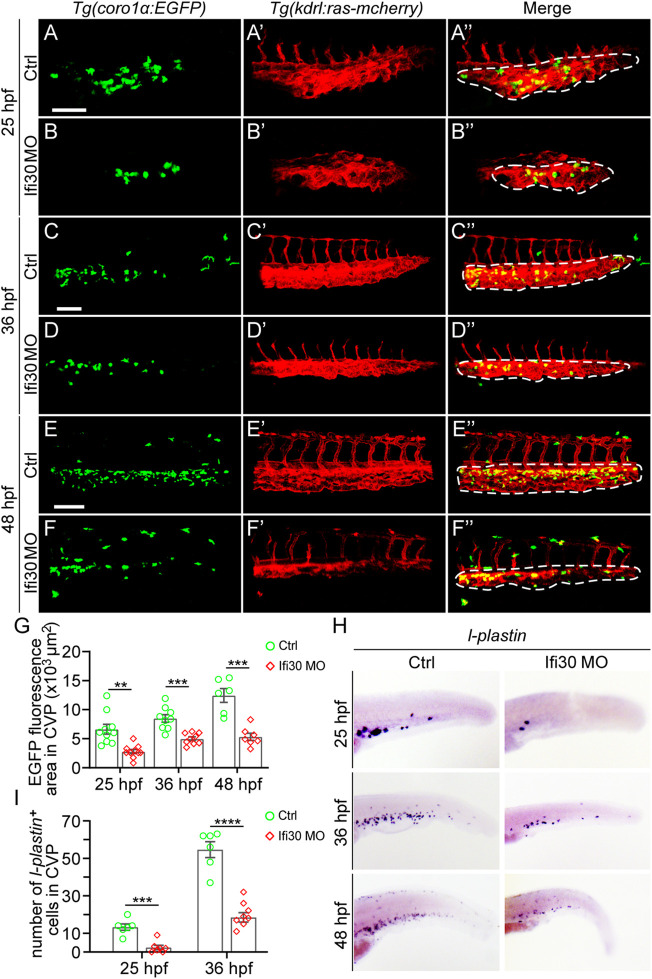
Fig. 6
Macrophages are reduced upon Ifi30 knockdown (A–F") Confocal images of Tg(kdrl:ras-mCherry);Tg(coro1a:EGFP) double transgenic embryos and embryos injected with Ifi30 MO at 25 hpf (A,B"), 36 hpf (C,D"), and 48 hpf (E,F") (G) Fluorescence intensities in the CVP region (dashed line outlined area) of GFP channel are quantified with ImageJ (H) In situ hybridization (ISH) assay of l-plastin (macrophage marker) in wild-type (WT) and Ifi30 morphant embryos at 25, 36, and 48 hpf, respectively. The number of l-plastin-positive cells in the CVP region (dashed line outlined area) is counted and compared between WT and Ifi30 morphants (I). Error bars represent SEM. **, p < 0.01. ***, p < 0.001. ****, p < 0.0001. Scale bars, 100 µm.