
Image
|
Figure Caption
Fig. 1
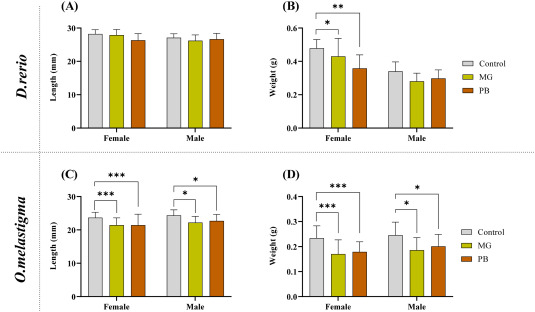
Fig. 1. Body length and weight of zebrafish (A and B) or marine medaka (C and D) at 6 mpf, after MG and PB MPs exposures. (Mean ± SD, Tukey HSD test, * indicates significant differences from respective control of same sex with * p < 0.05; **p < 0.001; ***p < 0.0001; n = 11 to 53 per sex and per treatment).
Acknowledgments
This image is the copyrighted work of the attributed author or publisher, and
ZFIN has permission only to display this image to its users.
Additional permissions should be obtained from the applicable author or publisher of the image.
Full text @ Environ. Pollut.