IMAGE

Figure 3

ID
ZDB-IMAGE-220801-120
Source
Figures for Hu et al., 2022
Image
Figure Caption

Figure 3

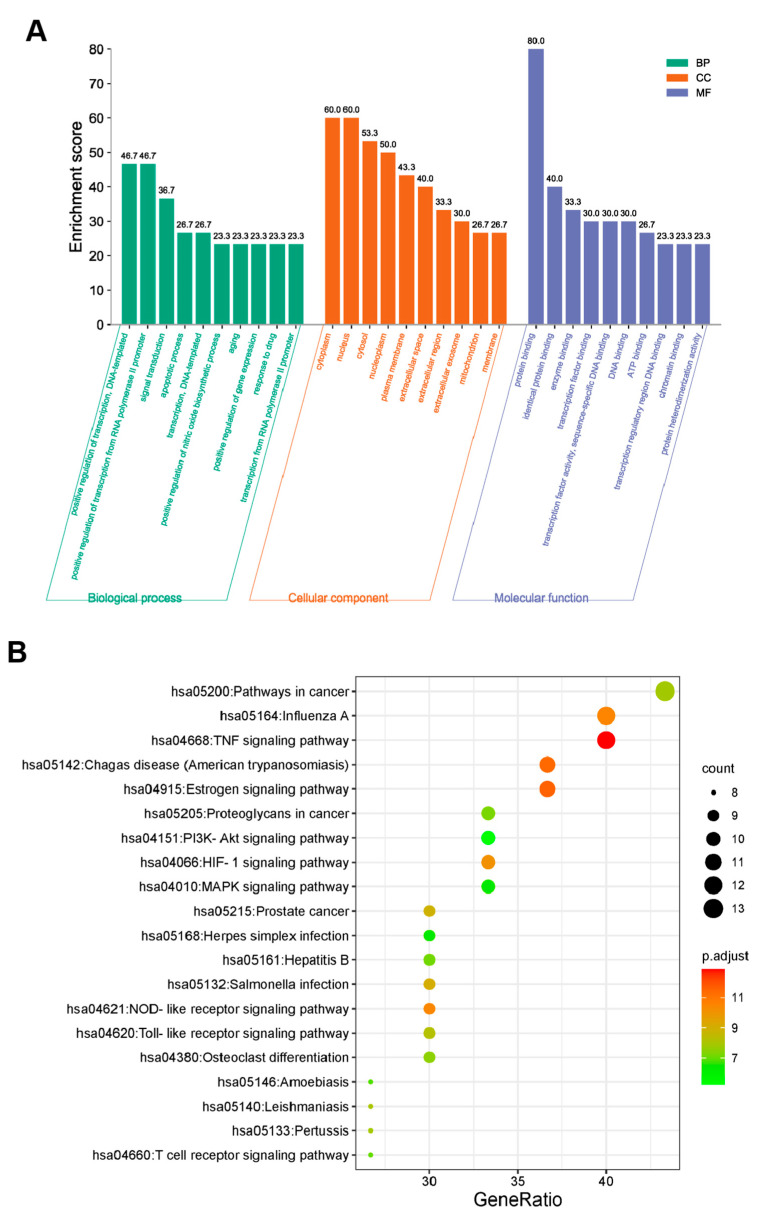
GO terms and KEGG pathway enrichment analysis of 30 common targets (p-value < 0.05). (A) GO enrichment analysis of the intersection targets. The abscissa represents the GO term; the ordinate represents the proportion of genes. Green, orange, and blue represent the top 10 biological process, cellular components, and molecular functions, respectively. (B) The top 20 significant KEGG pathways. The abscissa depicts the proportion of genes, while the ordinate indicates the name of the KEGG signal pathway. The dot size and color scales indicated the number of enriched genes and the different thresholds for the p-value.

Acknowledgments
This image is the copyrighted work of the attributed author or publisher, and ZFIN has permission only to display this image to its users. Additional permissions should be obtained from the applicable author or publisher of the image. Full text @ Life (Basel)