
Image
|
Figure Caption
Fig. 3
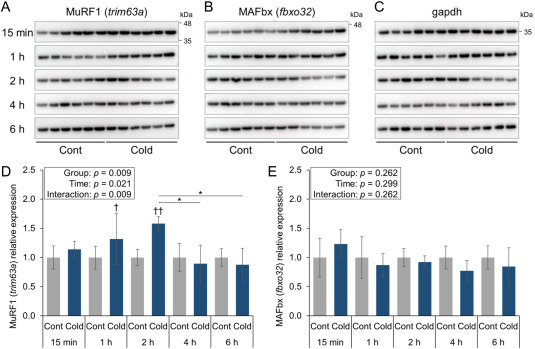
Fig. 3. The result of western blotting A–C. Gel images of MuRF1 (trim63a), MAFbx (fbxo32), and gapdh. D and E. Time-course changes of MuRF1 and MAFbx (n = 6 for both conditions). All data are presented as relative gene expression in comparison to the reference protein gapdh. In the post-hoc test, ∗p < 0.05 indicated significance in the comparisons between different time points, and †p < 0.05 and ††p < 0.01 indicated significance in the comparisons between the cold and control [cont] groups at each time point.
Acknowledgments
This image is the copyrighted work of the attributed author or publisher, and
ZFIN has permission only to display this image to its users.
Additional permissions should be obtained from the applicable author or publisher of the image.
Full text @ Biochem. Biophys. Res. Commun.