
|
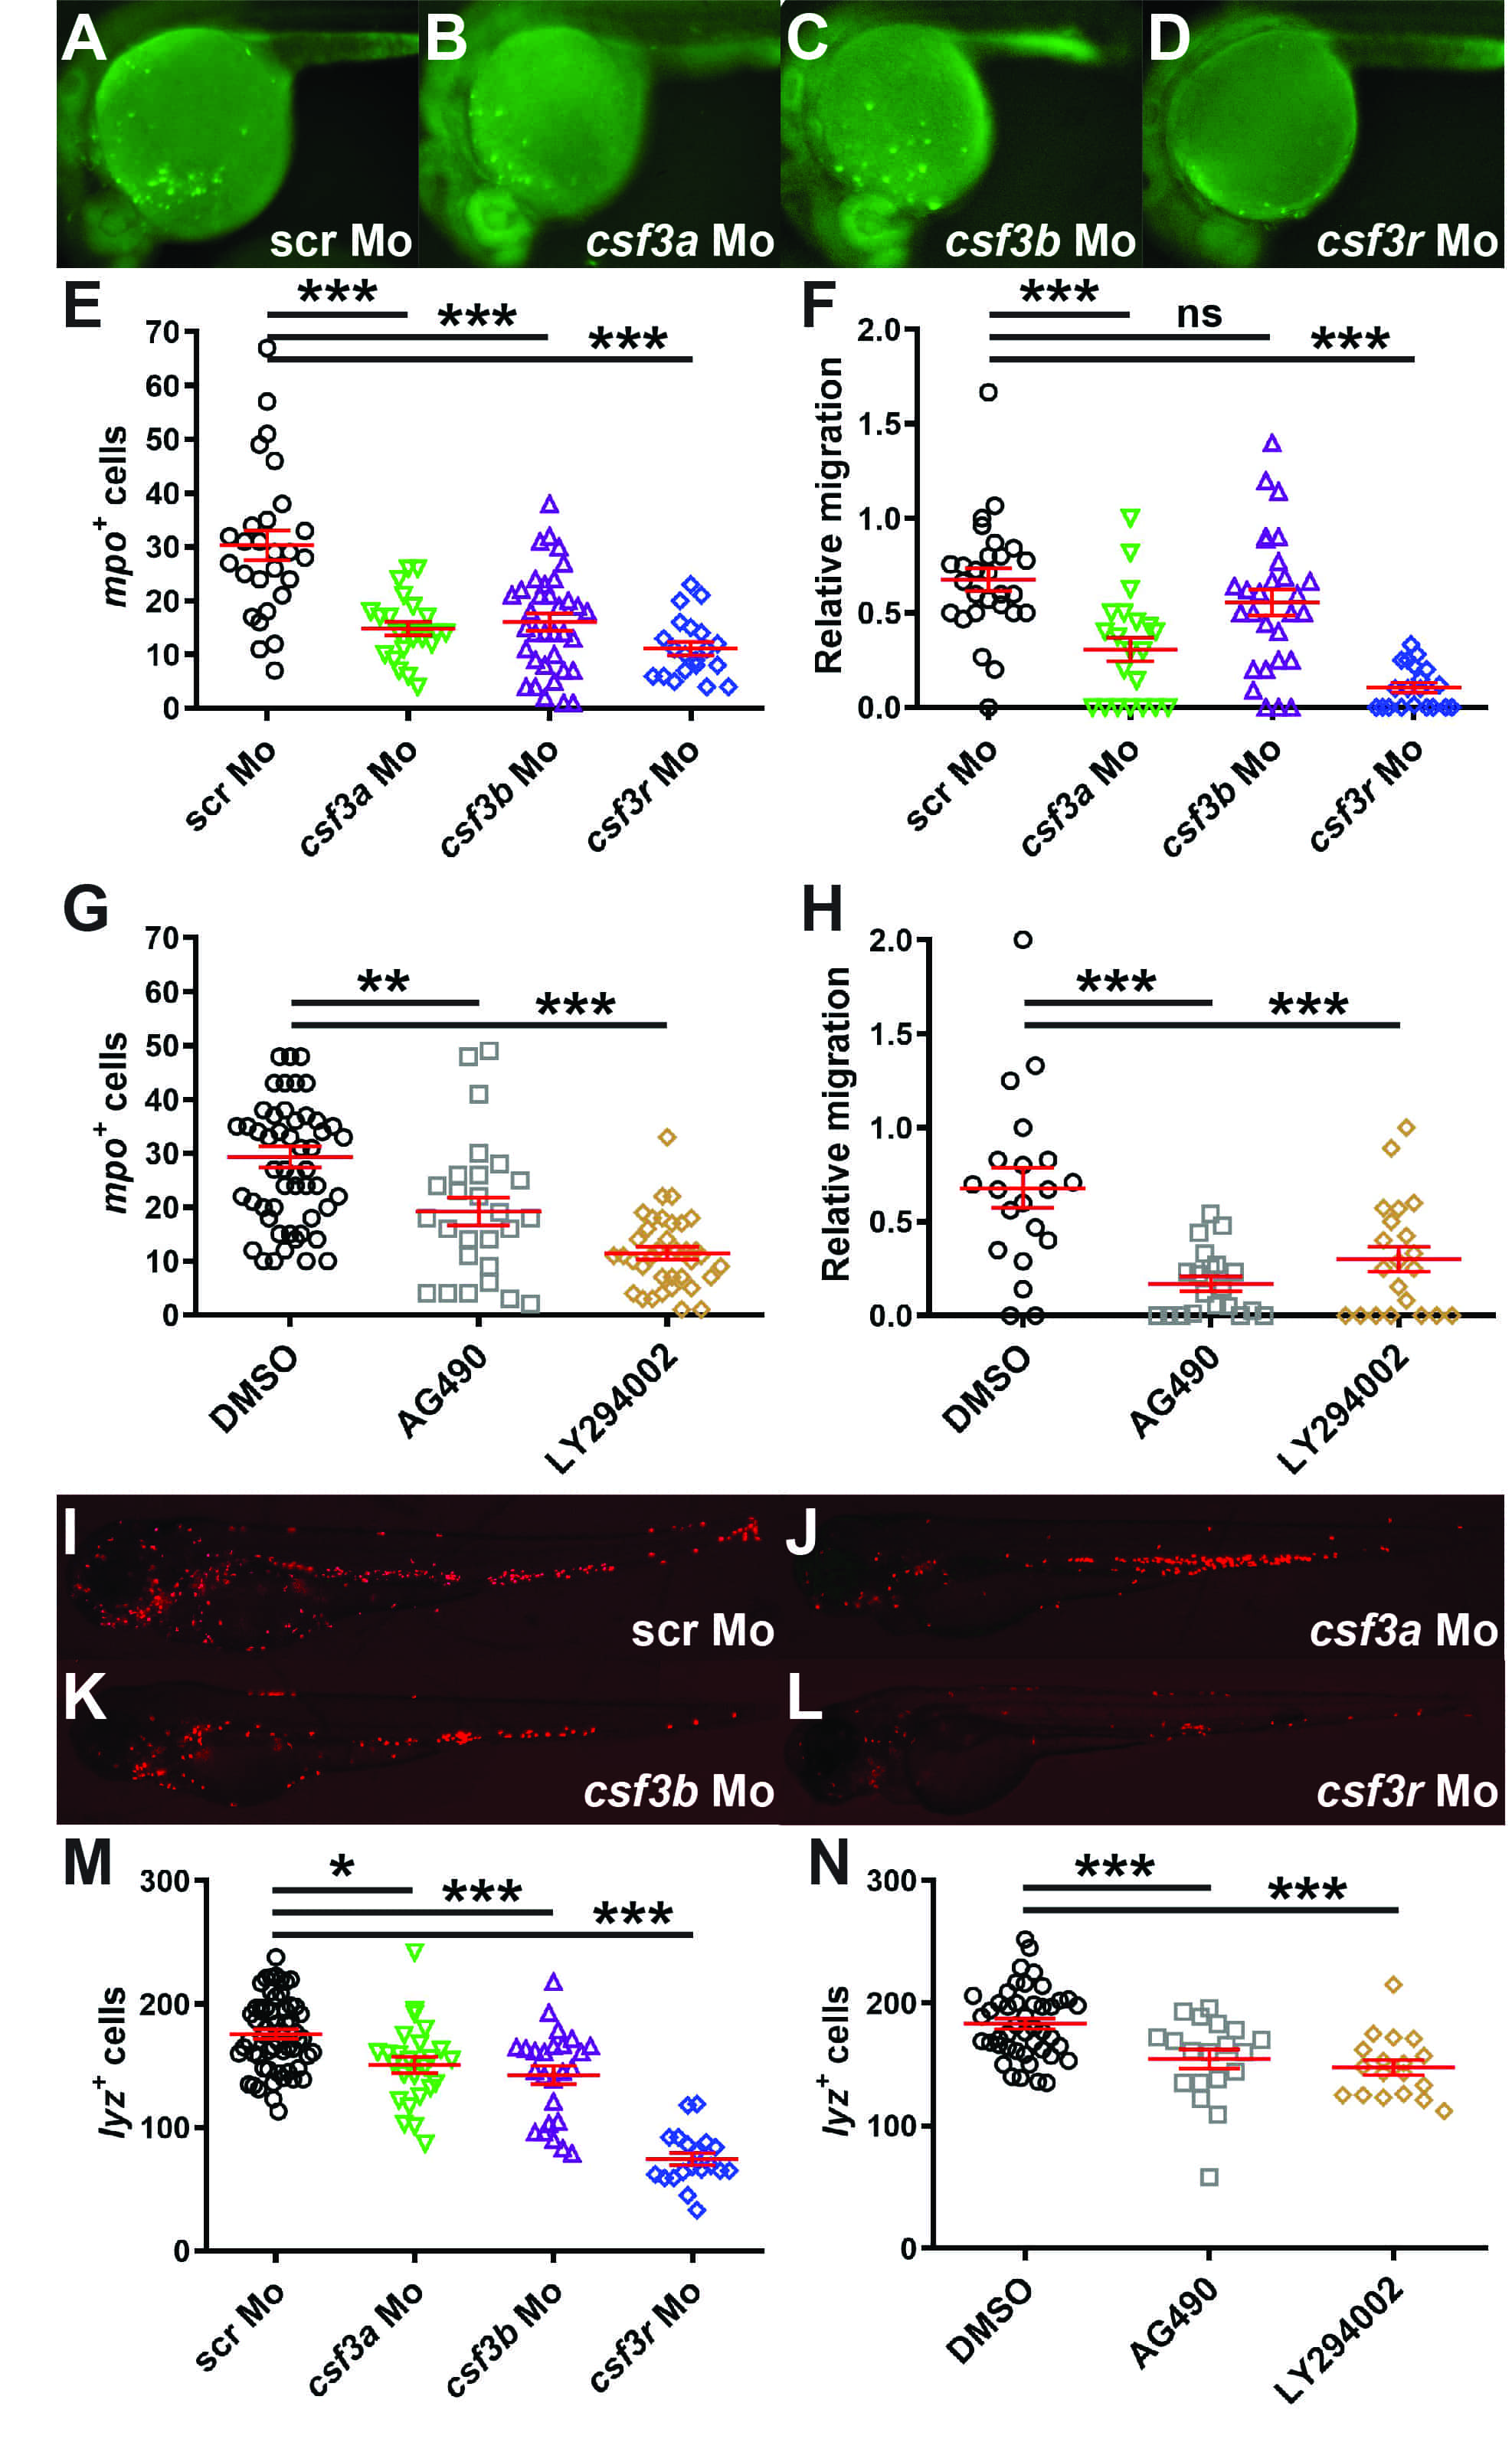
Fig. 1
Alternative G-CSFR pathways in myelopoiesis. (A–D) Fluorescent microscopy images of representative 22 hpf Tg (mpo::GFP) embryos injected with either scr Mo (A), csf3a Mo (B), csf3b Mo (C) or csf3r Mo (D). (E,G) Quantitation of the number of mpo+ cells in embryos injected with morpholinos (E) or treated with specific inhibitors (G). (F,H) Quantitation of relative migration of mpo+ cells in embryos injected with morpholinos (F) or specific inhibitors (H). (I–L) Fluorescent microscopy images of representative 48 hpf Tg (lyz::DsRed) embryos injected with either scr Mo (I), csf3a Mo (J), csf3b Mo (K) or csf3r Mo (L). (M,N) Quantitation of lyz+ cells in embryos injected with morpholinos (M) or specific inhibitors (N). In panels E–H and M–N, results are shown for individual embryos along with mean and SEM in red, with the level of statistical significance relative to controls indicated (*: p