
Fig. 6
- ID
- ZDB-IMAGE-220718-22
- Publication
- Li et al., 2022 - Estrogens revert neutrophil hyperplasia by inhibiting Hif1α-cMyb pathway in zebrafish myelodysplastic syndromes models
- All Figures
- Figures for Li et al., 2022
|
Fig. 6
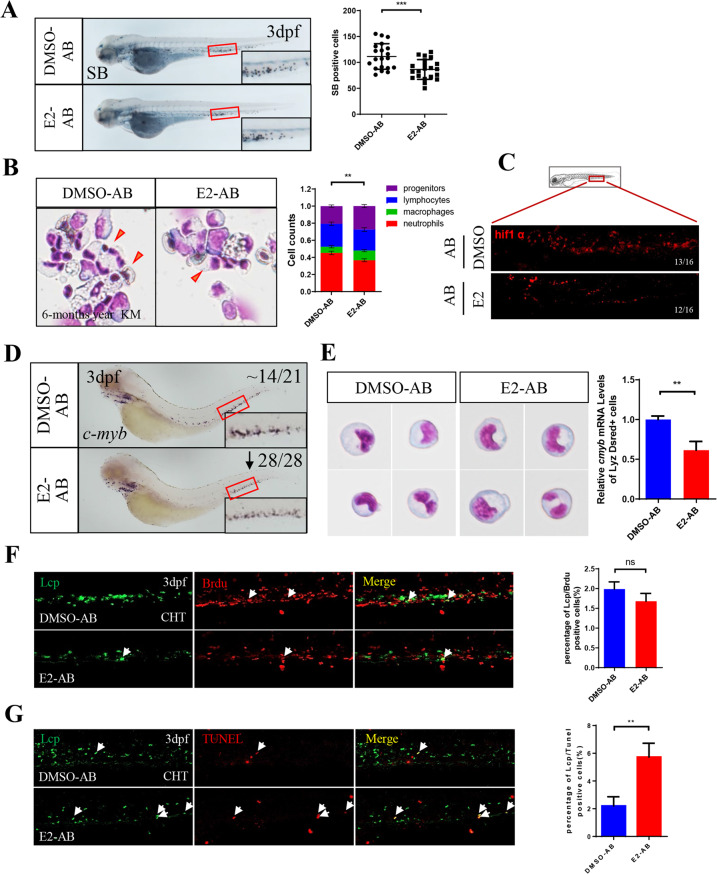
A E2 decreased neutrophils in AB zebrafish embryos. (t-test, ***p < 0.001, n > 20). B May–Grunwald–Giemsa staining of whole KM blood cells in 6-month-old AB zebrafish after 4 days of E2 treatment (t-test, ***p < 0.001, n = 12). Red arrowheads, blue asterisks, black arrowheads and yellow lightning indicates neutrophils, precursors, lymphocytes and macrophages, respectively. C Staining of hif1α with antibody with or without E2 treatment. D E2 exposure decreased c-myb in the CHT, as determined by WISH. E qPCR quantification of decreased c-myb expression in lyz:Dsred+ cells by E2 (t-test, mean ± SEM. ***p < 0.001, **p < 0.01, *p < 0.05, n > 20). F Effect of E2 on neutrophil proliferation in AB zebrafish embryos. (one-way ANOVA (LSD). ns, no significance, n > 10). G E2 promotes the apoptosis of myeloid lineage cells in AB zebrafish embryos (one-way ANOVA (LSD) **p < 0.01. n > 10).