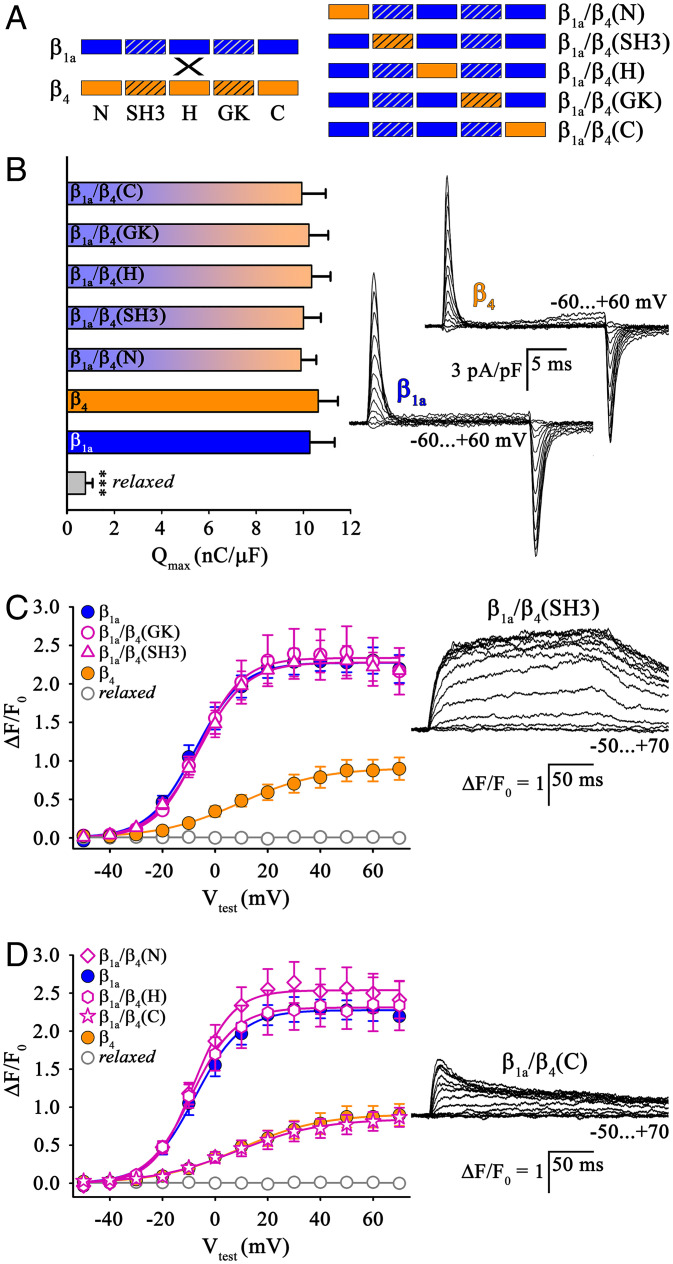
IMAGE

Fig. 2.

ID
ZDB-IMAGE-220717-6
Source
Figures for Dayal et al., 2022
Image
Figure Caption

Fig. 2.

Loss-of-function β1a4 chimeras revealed the importance of the β1a C terminus in skeletal muscle DHPR–RyR1 coupling. (A) Block schemes of domain organization of putative loss-of-function β1a4 chimeras with systematic exchange of N terminus (N), SH3 domain (SH3), HOOK region (H), GK domain (GK), or C terminus (C) of β1a (blue) by β4 sequences (orange). Homologous SH3 and GK domains are represented by hatched boxes. (B, Left) Analyses of voltage dependence of integrated outward gating currents normalized to cell capacitance exhibited maximum charge movement (Qmax) values indistinguishable (P > 0.05) between relaxed myotubes expressing β1a (n = 16), β4 (n = 12), β1a4(N) (n = 21), β1a4(SH3) (n = 19), β1a4(H) (n = 24), β1a4(GK) (n = 15), or β1a4(C) (n = 13). Qmax values from untransfected relaxed myotubes were slightly above detection level (P < 0.001, n = 11). (Right) Representative Q recordings from relaxed myotubes expressing either β1a or β4. (Scale bars, 5 ms [horizontal], 3 pA/pF [vertical].) (C and D) Cytoplasmic Ca2+ transient restoration was comparable (P > 0.05) between relaxed myotubes expressing β1a (n = 9), β1a4(SH3) (n = 17), β1a4(GK) (n = 11), β1a4(N) (n = 14), or β1a4(H) (n = 16). By contrast, ΔF/F0 values were significantly lower (P < 0.001) for chimera β1a4(C) (n = 12) and similar (P > 0.05) to those of β4 (n = 13). Exemplar Ca2+ transient recordings from relaxed myotubes expressing β1a4(SH3) (C, Right) or β1a4(C) (D, Right). (Scale bars, 50 ms [horizontal], ΔF/F0 = 1 [vertical].) Error bars indicate SEM. P determined by unpaired Student’s t test, ***P < 0.001.

Acknowledgments
This image is the copyrighted work of the attributed author or publisher, and ZFIN has permission only to display this image to its users. Additional permissions should be obtained from the applicable author or publisher of the image. Full text @ Proc. Natl. Acad. Sci. USA