
Figure 4.
- ID
- ZDB-IMAGE-220717-54
- Genes
- Publication
- Bresciani et al., 2021 - Redundant mechanisms driven independently by RUNX1 and GATA2 for hematopoietic development
- All Figures
- Figures for Bresciani et al., 2021
|
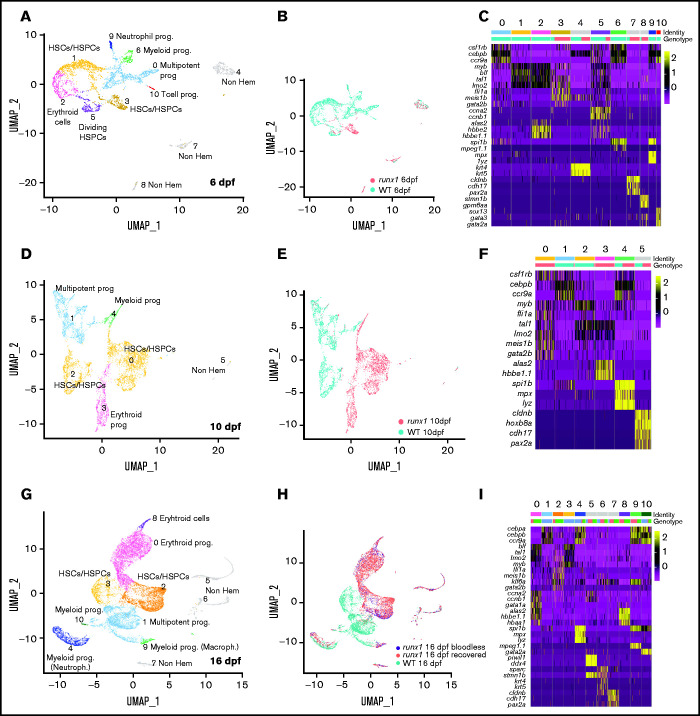
Figure 4.
Single-cell analysis of wild-type and runx1del8/del8 cd41:GFPlow at 6, 10, and 16 dpf show only few overlapping populations. UMAP of freshly FACS-isolated cd41:GFPlow cells from wild-type and runx1del8/del8 embryos at 6 (A), 10 (D), and 16 dpf (G). Colored clusters represent hematopoietic cells; gray clusters are nonhematopoietic (based on expression profile). UMAP depicting the genotypes of the cd41:GFPlow cells at 6 (B), 10 (E), and 16 (H). Mint dots, wild type; magenta dots, runx1del8/del8 (B,E). At 16 dpf, mint dots represent wild type; magenta dots, runx1del8/del8 with circulating blood cells (recovered); blue dots, bloodless runx1del8/del8. (C,F,I) Heat maps depicting the expression of signature genes representative of different cell identities in each of the clusters identified, respectively, in panels A, D, and G. The horizontal bars on the top correspond to the clusters identified the correspondent UMAP (Identity) and show the distribution of the 2 genotypes (Genotype) across the clusters. One hundred representative cells per clusters are shown. See also supplemental Figures 3 and 4 for additional scRNA-seq data.