
Fig. 7
- ID
- ZDB-IMAGE-220715-49
- Genes
- Antibodies
- Publication
- Berger et al., 2022 - Mob4-dependent STRIPAK involves the chaperonin TRiC to coordinate myofibril and microtubule network growth
- All Figures
- Figures for Berger et al., 2022
|
Fig. 7
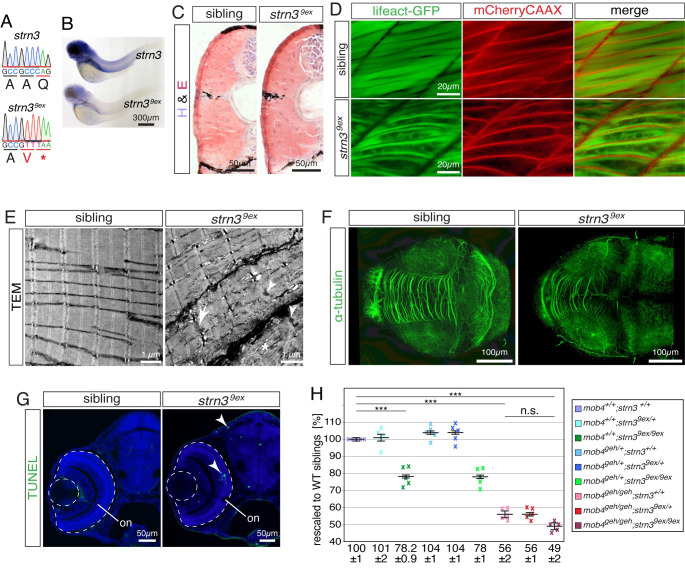
(A) The genomic sequence of the strn39ex allele harboured a deletion of 23,516 bp and simultaneous insertion of 35 bp. (B) In comparison to 3-dpf-old siblings, the signal intensity of the in situ hybridisation using a strn3 probe was strikingly diminished in strn39ex homozygotes (n = 5 per genotype). (C) Fibrotic signs were not detected on representative cross sections of 3-dpf-old strn39ex homozygotes and siblings stained with H&E (n = 6 per genotype). (D) The transgenic marker lines Tg(acta1:lifeact-GFP) and Tg(acta1:mCherryCAAX) revealed that the sarcomere striation of live 3-dpf-old siblings was strikingly reduced in strn39ex homozygotes, which featured disorganised thin filaments instead (n = 7 per genotype). (E) The sarcomere organisation shown in representative transmission electron micrographs of 3-dpf-old siblings was frequently compromised in strn39ex homozygotes. Instead, strn39ex homozygotes featured widened Z-disks (arrow), filament deposits (asterisk) and lattice-patterned electron-dense structures (arrowheads) (n = 3 per genotype). (F) Representative Z-stacks of 3-dpf-old larvae stained with antibodies against acetylated α-tubulin. In contrast to their siblings, the intertectal commissure of strn39ex homozygotes was strikingly reduced with less neurites projecting across tectal lobes (n = 5 per genotype). (G) Enhanced apoptosis within the retina and tectum of 3-dpf-old representative strn39ex homozygotes was confirmed by TUNEL assay (n = 12 per genotype). (H) At 3 dpf, the birefringence of single strn39ex homozygotes (78.2 ± 0.9%) and mob4geh homozygotes (56 ± 2%) as well as strn39ex;mob4geh compound homozygotes (49 ± 2%) was significantly reduced compared to their WT siblings (100 ± 1%). Importantly however, the birefringence of strn39ex;mob4geh compound homozygotes was not significantly reduced compared to their single mob4geh homozygous siblings. Crosses represent averaged birefringence of clutches with a minimum of 4 larvae per genotype (n = 5 clutches). Data are presented as mean ± SEM; *** P < 0.001 calculated by Student’s t-test. Scale bar sizes are indicated.