
Fig. 1
- ID
- ZDB-IMAGE-220705-53
- Genes
- Publication
- Lu et al., 2022 - Fish female-biased gene cyp19a1a leads to female antiviral response attenuation between sexes by autophagic degradation of MITA
- All Figures
- Figures for Lu et al., 2022
|
Fig. 1
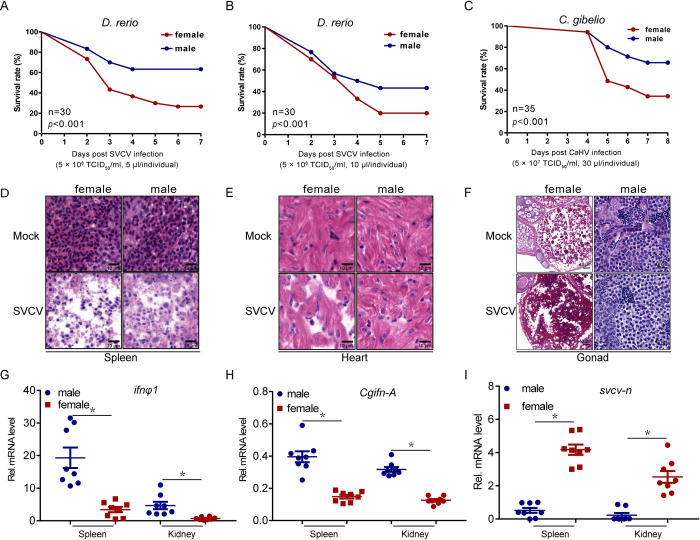
(A-B) Survival (Kaplan-Meier Curve) of male and female zebrafish (n = 30 per group) at various days after i.p. injected with SVCV (5 × 10⁸ TCID50/ml, 5 μl or 10 μl/individual). (C) Wild-type Male and female gibel carp (n = 35 per group) were i.p. injected with CaHV (5 × 10⁷ TCID50/ml, 30 μl/individual) and the survival rate was calculated. (D-F) Microscopy of H&E-stained spleen (D), heart (E), and gonad (F) sections from male and female zebrafish treated with SVCV (5 × 10⁸ TCID50/ml, 5 μl/individual) for 72 h. (G) qPCR analysis of ifnφ1 mRNA in the spleen and kidney of male and female zebrafish (n = 8 per group) given i.p. injection of SVCV (5 × 10⁸ TCID50/ml, 5 μl/individual) for 48 h. Each dot point represents one independent biological replicate. *p < 0.05. (H) qPCR analysis of Cgifn-A mRNA in the spleen and kidney of male and female gibel carp (n = 8 per group) given i.p. injection of CaHV (5 × 10⁷ TCID50/ml, 30 μl/individual) for 48 h. Each dot point represents one independent biological replicate. *p < 0.05. (I) qPCR analysis of svcv-n mRNA in the spleen and kidney of zebrafish (n = 8 per group) given i.p. injection of SVCV (5 × 10⁸ TCID50/ml, 5 μl/individual) for 48 h. *p < 0.05.