
Image
|
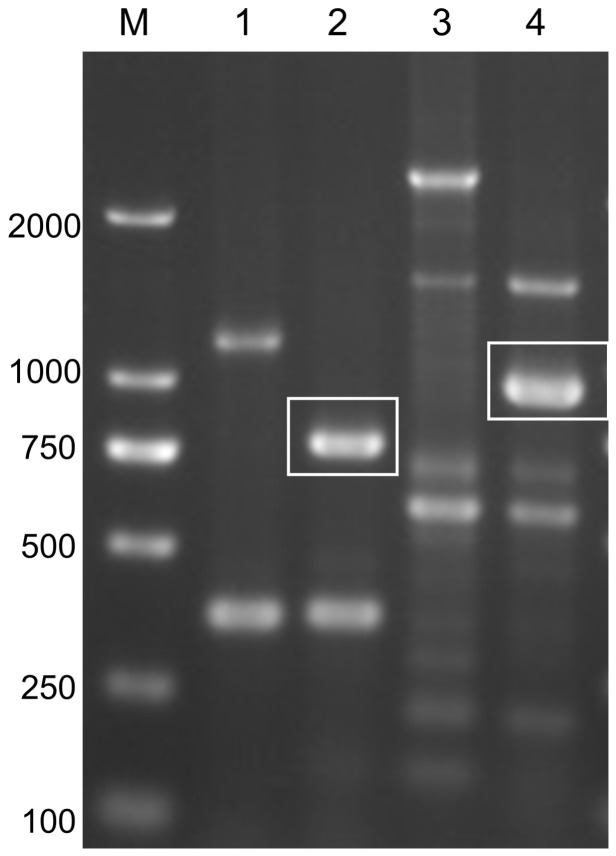
Figure Caption
Fig. 3
Electrophoresis image of PCR products in agarose gel. M: DL2000 bp marker; Line 1: the PCR product amplified from wild-type zebrafish genome by using GFP-F/R primers; Line 2: the PCR product amplified from EYE lines genome by using GFP-F/R primers; Line 3: the PCR product amplified from wild-type zebrafish genome by using Krt4-F and GFP-R primers; 4: the PCR product amplified from EYE lines genome by using Krt4-F and GFP-R primers. White boxes indicate the target bands (720 bp in Line 2, 916 bp in Line 4).
Acknowledgments
This image is the copyrighted work of the attributed author or publisher, and
ZFIN has permission only to display this image to its users.
Additional permissions should be obtained from the applicable author or publisher of the image.
Full text @ Curr. Iss. Mol. Biol.