
IMAGE
Fig. 8
- ID
- ZDB-IMAGE-220628-72
- Genes
- Publication
- Deng et al., 2022 - Deleterious Variation in BR Serine/Threonine Kinase 2 Classified a Subtype of Autism
- All Figures
- Figures for Deng et al., 2022
Image
|
Figure Caption
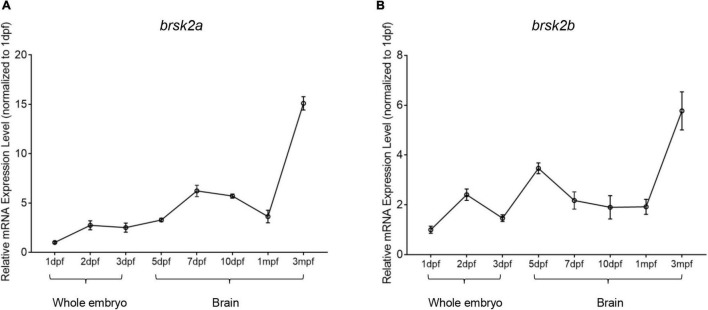
Fig. 8
Temporal mRNA expression profiling of zebrafish brsk2. The mRNA expression levels of brsk2a (A), brsk2b (B) at 8 stages (Data are shown as mean ± SEM, n = 3 for each genotype). mRNA was extracted from whole embryos of 1 dpf, 2 dpf, 3 dpf, and brain tissues of 5 dpf, 7 dpf, 10 dpf, 1 mpf, and 3 mpf.
Figure Data
Acknowledgments
This image is the copyrighted work of the attributed author or publisher, and
ZFIN has permission only to display this image to its users.
Additional permissions should be obtained from the applicable author or publisher of the image.
Full text @ Front. Mol. Neurosci.