
|
Fig. 3
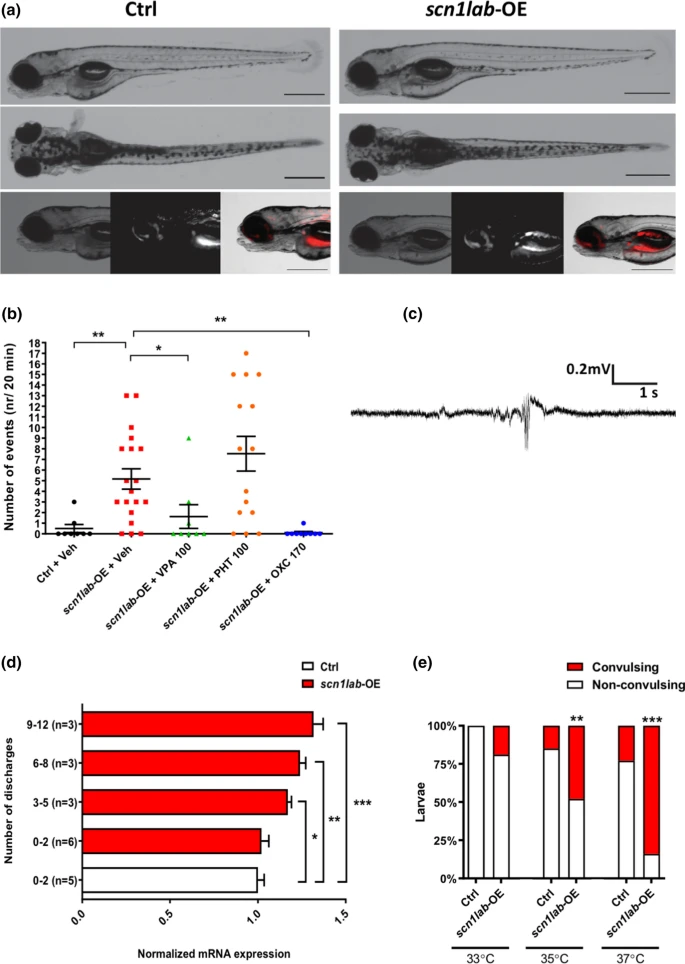
Overexpression of scn1a in zebrafish increases seizure susceptibility and temperature sensitivity. a Representative images of control (Ctrl; left panel) and scn1lab-OE larvae (right panel). Red colour depicts mCherry fluorescence. b Number of EEG discharges in control and scn1lab-OE larvae. Horizontal bars represent mean ± SEM. Sample sizes: Ctrl, n = 8; scn1lab-OE + Veh, n = 19; scn1lab-OE + valproic acid (VPA) (100 µM), n = 8; scn1lab-OE + phenytoin (PHT) (100 µM), n = 15; scn1lab-OE + oxcarbazepine (OXC) (170 µM), n = 9. **P < 0.01, *P < 0.05 (One-way ANOVA with Tukey’s post-hoc). Abbreviations: VPA-valproic acid, PHT-phenytoin, OXC- oxcarbazepine. c An example of EEG recordings obtained from the optic tecta of 4 dpf scn1lab-OE larvae. d Number of discharges recorded in scn1lab-OE larvae relative to scn1lab mRNA levels. Vertical bars represent mean ± SEM. e Percentage of larvae developing heat-induced seizures. Sample sizes: Ctrl, n = 18, n = 20 or n = 22 (for 33, 35 or 37 °C, respectively); scn1lab-OE, n = 16, n = 19 or n = 18 (for 33, 35 or 37 °C, respectively). ***P < 0.001, **P < 0.01 (Two-way ANOVA with Sidak’s multiple comparisons test)