
|
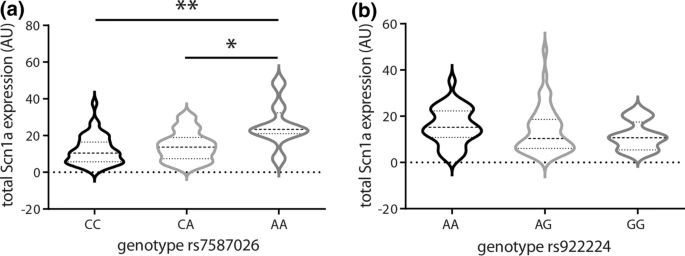
Fig. 1
rs7587026 genotype is correlated with SCN1A expression in individuals with MTLEHS, whereas rs922224 genotype is not. a,b Violin plots showing the expression levels of SCN1A in hippocampi of individuals with MTLEHS stratified by SNP genotype. Horizontal lines within the plots present median and quartiles. a Individuals with MTLEHS homozygous for the minor allele (rs7587026) have higher SCN1A expression levels compared to the other two genotypes (CC: n = 43, CA: n = 40, AA: n = 8; Kruskal–Wallis test: **P = 0.004, Dunn’s test: CC vs. AA: **P = 0.003, CA vs. AA: *P = 0.035). b No differences in SCN1A expression levels were observed by rs922224 genotype in MTLEHS (AA: n = 33, AG: n = 46, GG: n = 12; Kruskal–Wallis test: P = 0.226). See Supplementary Table 3 (online resource) for the expression level values