Fig. 4
Image
Figure Caption
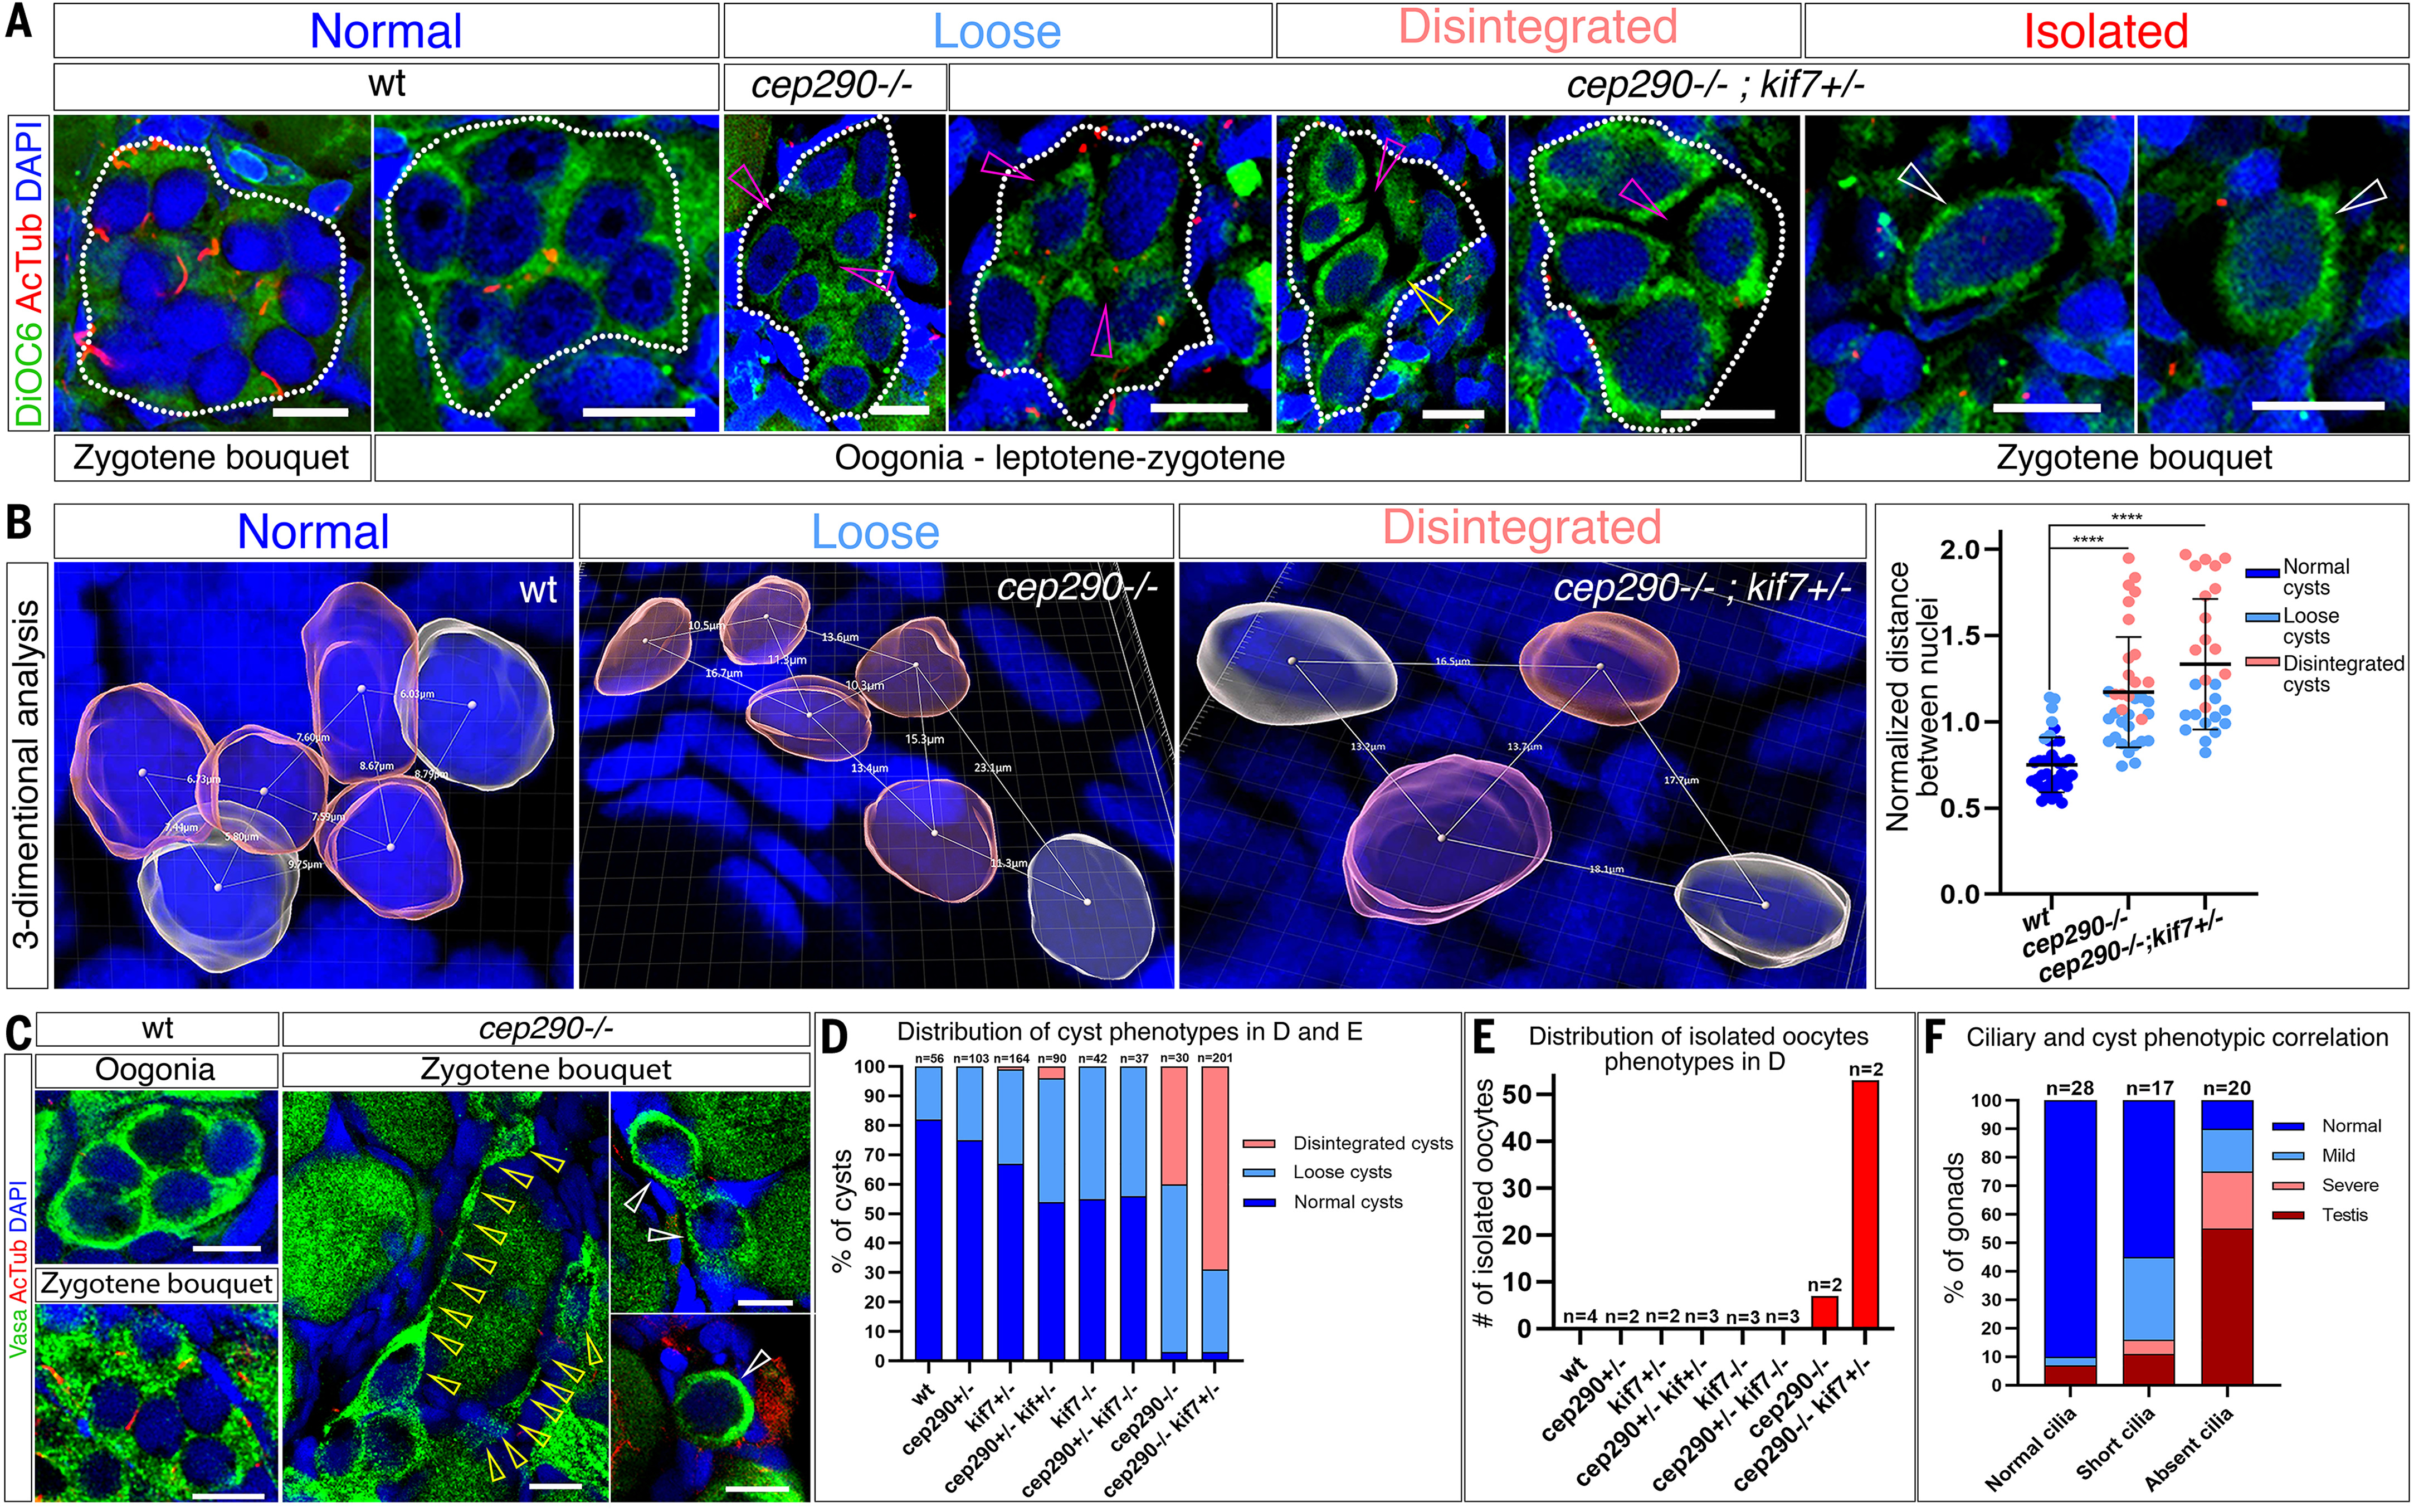
Fig. 4. The zygotene cilium is required for germline cyst morphogenesis.
(A, D, and E) Images of cyst (white outlines) phenotype categories labeled for the cytoplasmic marker DiOC6 and AcTub (A), showing gaps between oocytes (magenta arrows), elongated cytoplasmic bridges (yellow arrows) and isolated oocytes (white arrows). Scale bars, 10 μm. The percentage of cyst phenotype categories and number of isolated oocytes are shown in (D) (n, number of cysts) and (E) (n, number of ovaries), respectively. (B) Images of 3D cyst morphology analysis per category. Normalized distances are plotted. n = 5 to 7 cysts from n = 2 to 3 ovaries per genotype. Bars are mean ± SD. (C) Vasa and AcTub labeling shows normal cysts in wt ovaries, and disintegrated cysts (elongated CBs, yellow arrows) as well as isolated zygotene oocytes (white arrows) in cep290–/– ovaries. Phenotype distribution is plotted in fig. S11. Scale bars, 10 μm. (F) Severity of cyst phenotypes and gonad conversions plotted for three categories of ciliary defects pooled from all genotypes. n, number of gonads.
Acknowledgments
This image is the copyrighted work of the attributed author or publisher, and
ZFIN has permission only to display this image to its users.
Additional permissions should be obtained from the applicable author or publisher of the image.
Full text @ Science

