
Image
|
Figure Caption
Fig. 4
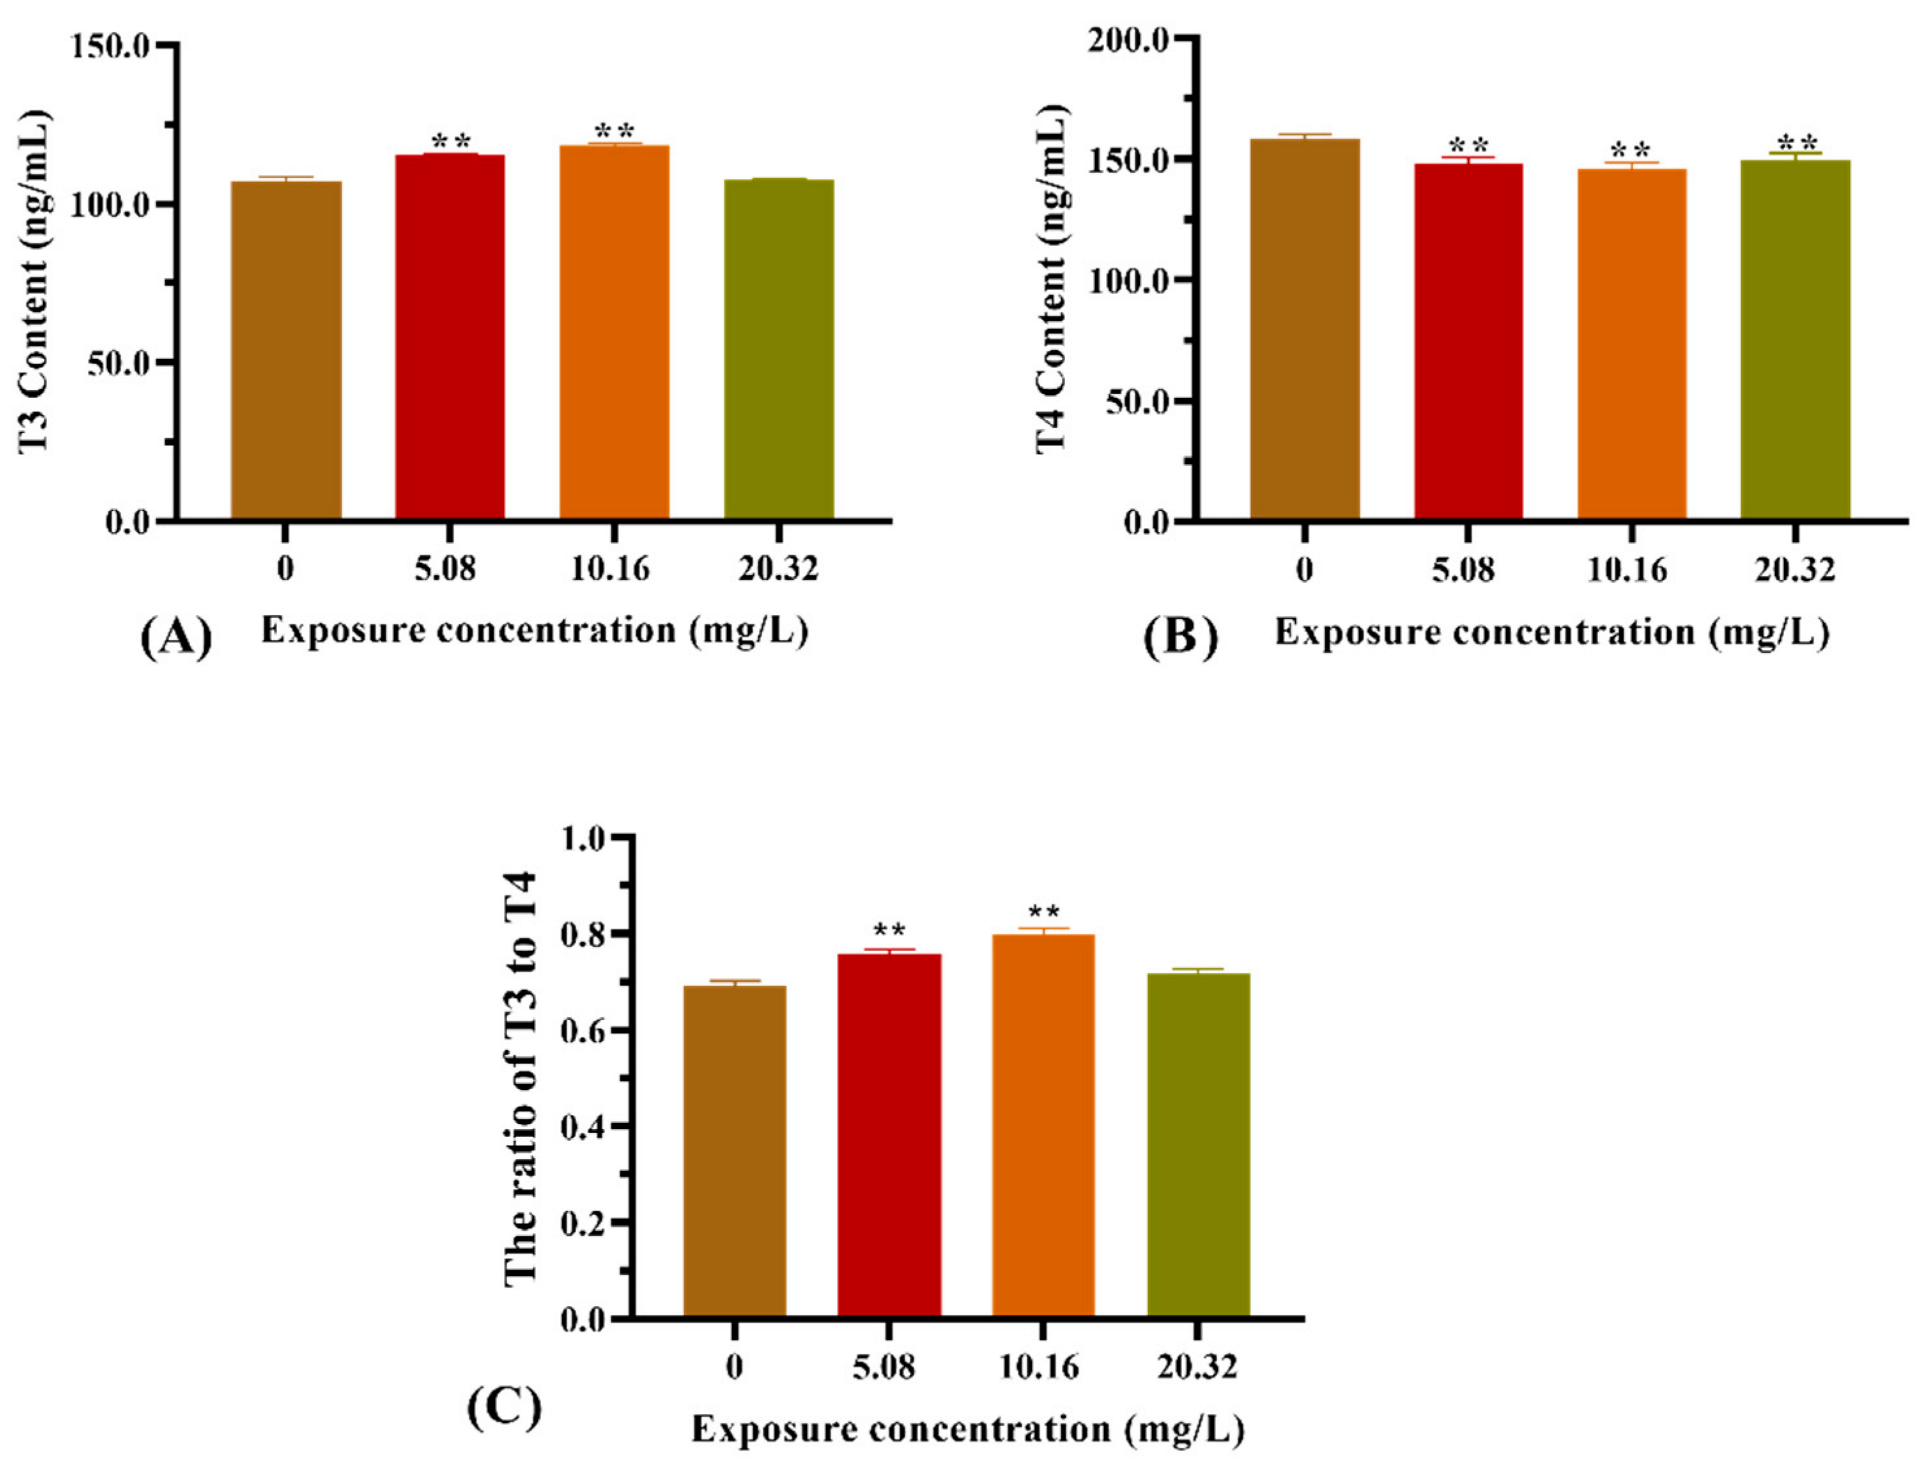
Figure 4. Effect of [C8mim]Cl exposure on the thyroid hormone levels of zebrafish larvae after 96 h. (A) T3 hormone, (B) T4 hormone, and (C) the ratio of T3 to T4. * p < 0.05, ** p < 0.01 express significant differences between the treatment group and control group.
Acknowledgments
This image is the copyrighted work of the attributed author or publisher, and
ZFIN has permission only to display this image to its users.
Additional permissions should be obtained from the applicable author or publisher of the image.
Full text @ Animals (Basel)