
Image
|
Figure Caption
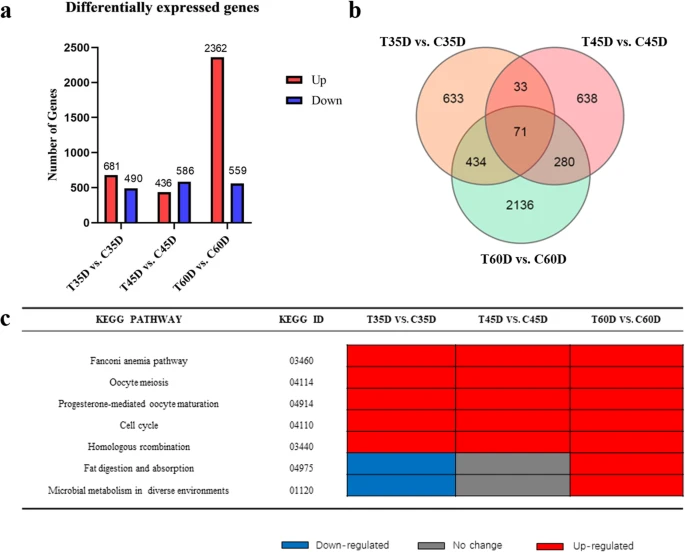
Fig. 3 Analysis of DEGs between high temperature and normal temperature treatments at 35dpf, 45dpf and 60dpf. Number of DEGs identified from each comparison groups (a), shown by Venn diagram (b), and list of pathways [29, 30] involved in the gonad development in juvenile fish (c)
Acknowledgments
This image is the copyrighted work of the attributed author or publisher, and
ZFIN has permission only to display this image to its users.
Additional permissions should be obtained from the applicable author or publisher of the image.
Full text @ BMC Genom Data