
Image
|
Figure Caption
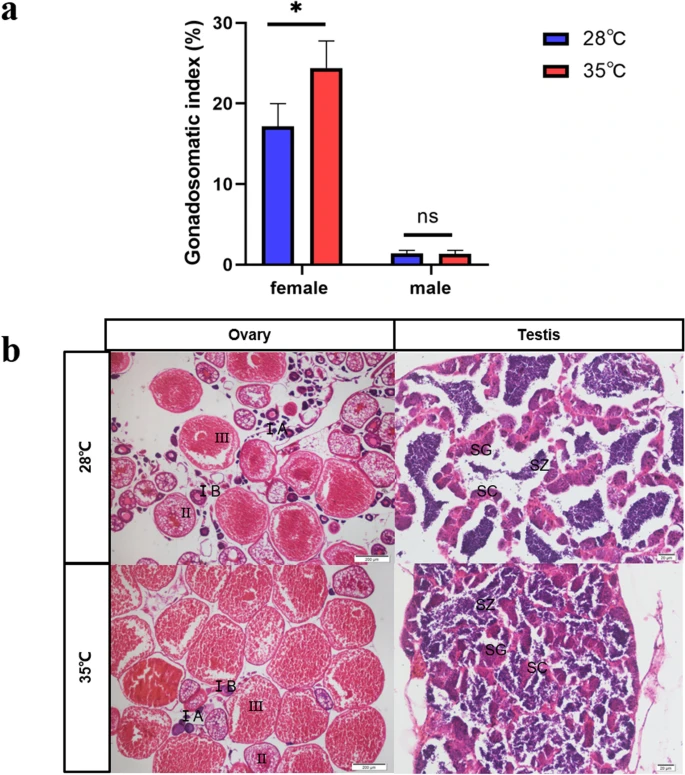
Fig. 2
Phenotypic identification and analysis of temperature-treated fish. (a) the comparative analysis of GSI between high temperature (35 °C) and normal temperature (28 °C) (T-test, *P < 0.05). (b) Histological analysis of gonad tissue. Stage IA and stage IB, primary growth stage; stage II, cortial alveolus stage; stage III, vitellogenesis stage; SC, spermatocytes; SG, spermatogonia; SZ, spermatozoa
Acknowledgments
This image is the copyrighted work of the attributed author or publisher, and
ZFIN has permission only to display this image to its users.
Additional permissions should be obtained from the applicable author or publisher of the image.
Full text @ BMC Genom Data