
Fig. 3
- ID
- ZDB-IMAGE-220601-3
- Publication
- Lelieveld et al., 2022 - Consequences of excessive glucosylsphingosine in glucocerebrosidase-deficient zebrafish
- All Figures
- Figures for Lelieveld et al., 2022
|
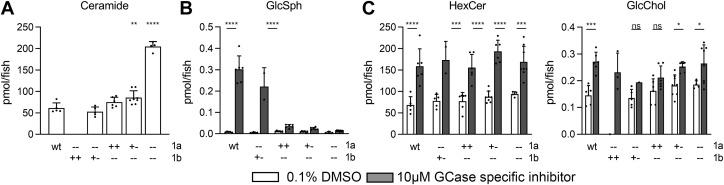
Fig. 3
Fig. 3. (Glyco)sphingolipid abnormalities in Asah1a- and/or Asah1b-deficient zebrafish larvae. A: Total ceramide levels (pmol/fish) were determined of individual zebrafish larvae (5 dpf) of off-spring of Asah1a+/-:asah1b+/- crossings. Data is depicted as mean ± SD and analyzed using a One-Way Anova with Dunnett’s multiple comparisons Test and WT as control group. B: Asah1a+/-:asah1b+/- adult zebrafish were crossed and off-spring was treated with vehicle (0.1% (v/v) DMSO) or 10 μm GCase specific inhibitor (ME656) for 5 days. Relevant lipid levels were determined of individual larvae in pmol/fish. WT (n = 5–6), asah1a-/-:asah1b+/- (n = 1–5), asah1a+/+:asah1b-/- (n = 6), asah1+/-:asah1b-/- (n = 7–8), and asah1a-/-:asah1b-/- (n = 4–8). Data is depicted as mean ± SD and analyzed using a Two-Way Anova with Sidak’s multiple comparisons test. Ns = not significant, ∗p < 0.05,∗∗p < 0.01, ∗∗∗p < 0.001, and ∗∗∗∗p < 0.0001.