
|
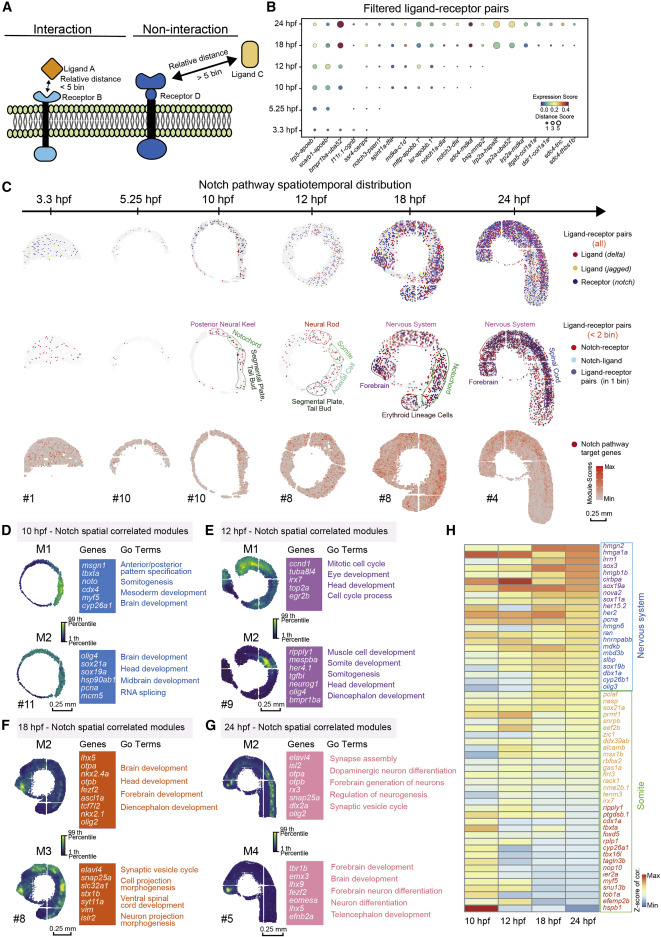
Fig. 5 Figure 5. The relative spatial distance of different ligand-receptor pairs reveals the arrangement and interaction of signaling pathways (A) Model diagram of the analysis of ligand-receptor relative distance. (B) A dotted heatmap shows the expression scores and relative distance scores of ligand-receptor pairs that passed the filter (relative distance <5 bins in at least one time point, and correlation Pearson r > 0.5, p value < 0.05). (C) Spatial expression pattern of notch family genes (blue), deltal family genes (red), and jagged family genes (yellow) on embryo sections at the 6 time points (top). Spatial expression pattern of Notch receptors (red), ligands (blue) with a relative distances less than 2 bins, and the ligand-receptor pairs expressed in the same bin (purple) (middle). Spatial expression pattern of Notch target genes (red) on the embryonic sections at different time points (bottom). Scale bars, 0.25 mm. (D–G) Gene modules identified using hotspot show spatial correlation with Notch pathway in 10- (D), 12- (E), 18- (F), and 24-hpf (G) embryos. Module scores are plotted on the left, and selected genes and GO terms related to spatially correlated modules are highlighted on the right. Scale bars, 0.25 mm. (H) A heatmap shows the temporal expression changes of genes selected from modules in Figures 5D–5G.
Reprinted from Developmental Cell, 57(10), Liu, C., Li, R., Li, Y., Lin, X., Zhao, K., Liu, Q., Wang, S., Yang, X., Shi, X., Ma, Y., Pei, C., Wang, H., Bao, W., Hui, J., Yang, T., Xu, Z., Lai, T., Berberoglu, M.A., Sahu, S.K., Esteban, M.A., Ma, K., Fan, G., Li, Y., Liu, S., Chen, A., Xu, X., Dong, Z., Liu, L., Spatiotemporal mapping of gene expression landscapes and developmental trajectories during zebrafish embryogenesis, 1284-1298.e5, Copyright (2022) with permission from Elsevier. Full text @ Dev. Cell